The OHLC Volume Histogram is a handy tool that visually represents the difference between two streams of the OHLC Volume indicator. It does this by displaying a colored histogram that traders can use to quickly gauge market sentiment.
One of the great things about this indicator is that it doesn’t require any input parameters, making it super user-friendly.
How It’s Calculated:
Histogram = StreamUP - StreamDN
Where:
StreamUP = Volume * UP_Coeff / (UP_Coeff + DN_Coeff)
StreamDN = Volume * DN_Coeff / (UP_Coeff + DN_Coeff)
UP_Coeff = High - Open
DN_Coeff = Close - Low
Volume = Tick Volume
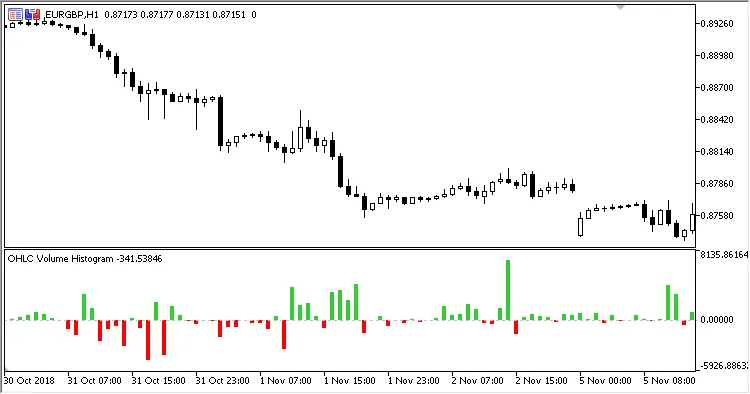
Fig. 1. OHLC Volume Histogram
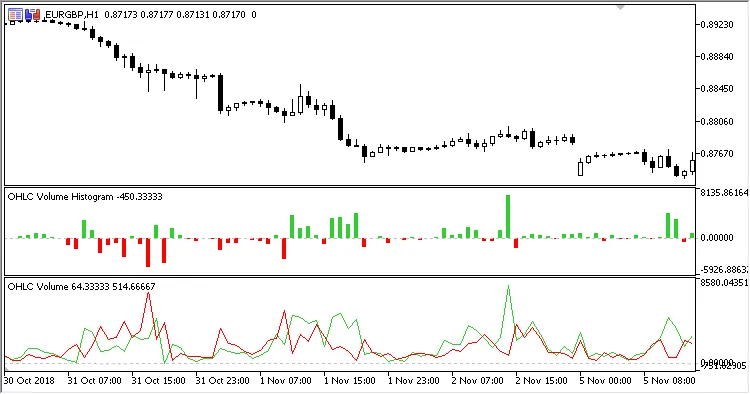
Fig. 2. OHLC Volume Histogram with OHLC Volume


Comments 0