Author: mladen
Welcome, fellow traders! Today, we're diving into the OnChart RSI indicator—an essential tool for spotting potential buy and sell signals in your trading strategy.
What is the OnChart RSI Indicator?
The OnChart RSI (Relative Strength Index) is a popular momentum oscillator that measures the speed and change of price movements. It helps traders identify overbought or oversold conditions, which can be pivotal for making informed trading decisions.
Key Parameters
Here’s a quick rundown of the parameters you’ll be working with:
- RSIPeriod: The number of periods used to calculate the RSI, typically set to 14.
- RSIPriceType: This determines the price type used in the calculation (0 for close price).
- maPeriod: The period for the moving average, often set to 20.
- maMethod: Select the method of moving average (1 for simple moving average).
- maPrice: The type of price used in the moving average calculation (0 for close price).
- overBought: The threshold indicating overbought conditions, usually set at 70.
- overSold: The threshold indicating oversold conditions, typically set at 30.
- timeFrame: The time frame you are analyzing, which can be set to your current timeframe.
Visual Guide
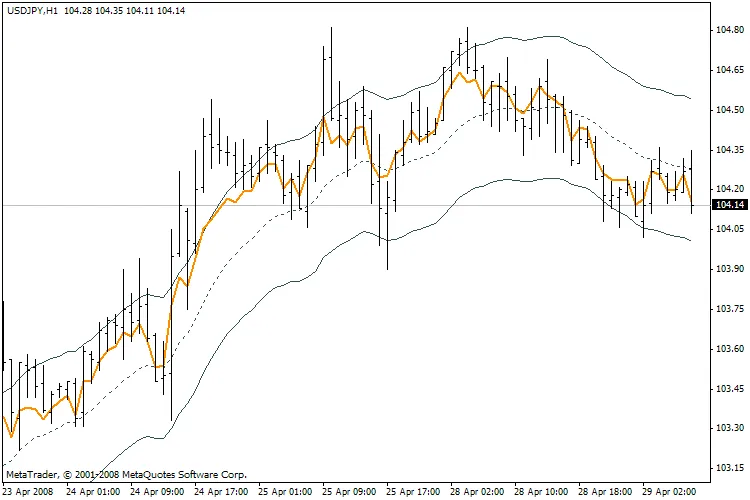
OnChart RSI Indicator
Using the OnChart RSI effectively can enhance your trading strategy by helping you identify potential reversal points in the market. Remember, while this tool is powerful, combining it with other indicators and analysis methods will provide a more rounded view of market conditions.
Happy trading!


Comments 0