Hey traders! Today, let's dive into a handy tool that can elevate your trading game: the Pivot Point Indicator. This little gem can help you identify potential support and resistance levels, giving you a clearer picture of market movements.
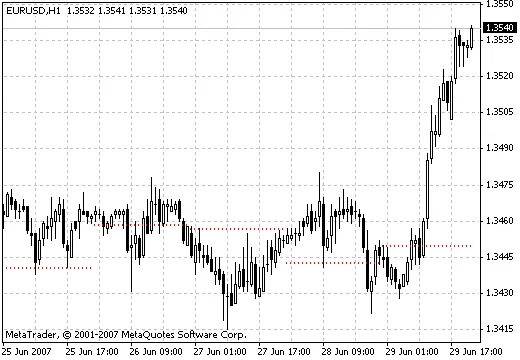
Check out the image below to see the Pivot Point Indicator in action:
What Is the Pivot Point Indicator?
The Pivot Point Indicator is a popular tool among traders for determining potential reversal points in the market. It calculates the average of the high, low, and closing prices from a previous period, which helps traders set their expectations for the next trading session.
Why Use the Pivot Point Indicator?
- Identifying Key Levels: It gives you a solid framework for understanding where the market might turn.
- Time-Saving: Instead of analyzing multiple charts, the pivot points provide clear levels at a glance.
- Versatility: Works across various time frames and financial instruments.
How to Calculate Pivot Points
The calculation is pretty straightforward:
- Pivot Point (PP): (High + Low + Close) / 3
- Support & Resistance Levels:
Support 1 (S1) = (PP x 2) - High
Resistance 1 (R1) = (PP x 2) - Low
Using these calculations, you can plot your levels on the chart and start making informed trading decisions.
Final Thoughts
Incorporating the Pivot Point Indicator into your trading strategy can enhance your ability to pinpoint market movements. As always, make sure to combine it with other analysis tools for the best results. Happy trading!


Comments 0