Author: Chayutra Sriboonruang
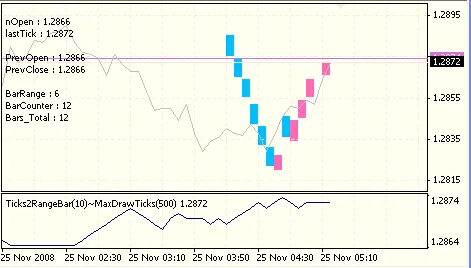
The Price Action Indicator is a powerful tool that can help you visualize market movements based on tick prices. Essentially, when the price drops by 10 pips, this indicator will plot a bearish candle on your chart. Conversely, if the price rises by 10 pips, it will display a bullish candle in a different color. This feature makes it easy to identify price fluctuations at a glance.
Key Features:
- Plots candles based on specified pip movements.
- Clearly distinguishes between upward and downward price movements.
- Customizable pip thresholds to suit your trading strategy.
Recommendations:
To get the most out of this indicator, I recommend attaching it to a line chart. This way, you can easily observe the bullish and bearish candles as they form, giving you a clearer picture of market dynamics.
Happy trading!


Comments 0