The Priliv_S indicator is a powerful tool that features three distinct lines, each representing trend speed across the current timeframe and two larger timeframes.
The beige line indicates calculations based on the smallest period, which corresponds to the current timeframe. This is your immediate market pulse.
The green line reflects the trend of the nearest larger timeframe, giving you insight into short-term market movements.
Lastly, the red line represents the trend in the next larger timeframe. This line can be applied to any timeframe, allowing you to see where the market might be headed in the broader context.
When you notice an inflection in the indicator, it's a sign that the trend direction has shifted. This can be crucial for making timely trading decisions.
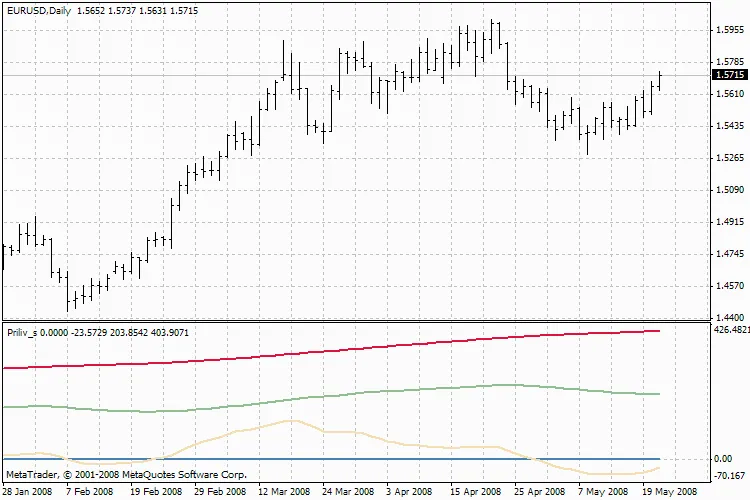
Priliv_S Indicator


Comments 0