The RAVI indicator, or Rate of Average Variation Indicator, is a handy tool in your trading toolkit. It uses two moving averages, calculated as a percentage, to help identify market trends.
Here’s the formula for the RAVI:
RAVI = 100 * (SMA(7) - SMA(65)) / SMA(65)
According to trading expert T. Chand, you should pay attention to certain information lines when using this indicator. These lines are typically set at plus/minus 0.3% or plus/minus 0.1%, depending on the market conditions. When the RAVI crosses the upper line, it suggests that a bullish trend is starting. Conversely, if it crosses the lower line, a bearish trend may be beginning. A trend is considered to be in play as long as the RAVI continues to rise; if it starts to fall, then a downtrend may be underway. If the RAVI approaches the zero line, it indicates that the trend may be ending and a channel phase could be starting. However, if the RAVI bounces back without crossing the information lines, it might signal that the trend has resumed.
This indicator is quite straightforward and bears similarities to the Price Oscillator and MACD. What sets it apart is its focus on the convergence-divergence of the rate as a trend indicator, emphasizing divergence rather than just the crossing of moving averages.
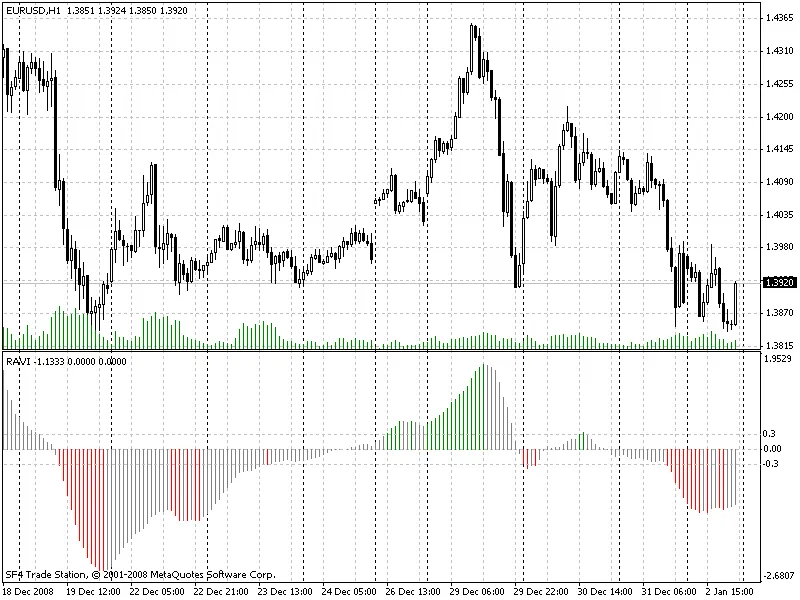
In this version of the RAVI, bullish trends are highlighted in green, while bearish trends are marked in red. Areas of uncertainty or no clear trend are shaded in grey. However, feel free to tweak the colors to suit your preferences!
In summary, the RAVI indicator can be a valuable addition to your trading strategy, providing clear insights into market trends. So why not give it a shot?


Comments 0