What is the RSX Indicator?
The RSX, or Relative Strength Index X, is often described as a "smoother RSI". What makes it stand out is its ability to deliver clearer signals without the additional lag that can sometimes hinder traditional RSI analysis. As a result, you'll find that RSX generates fewer signals compared to its counterpart, but many traders appreciate the precision it offers.
Combining Levels and Signal Lines
One of the key strategies for utilizing the RSX involves pairing it with specific levels or signal lines. Some traders swear by using levels, while others prefer to rely on signal lines. The best approach often boils down to your personal trading style.
To help bridge the gap between these two methods, we present a version that combines both concepts effectively.
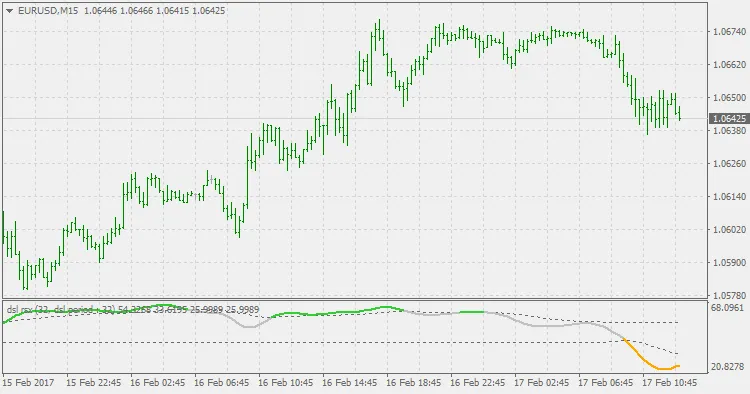
Introducing Discontinued Signal Lines
The idea behind Discontinued Signal Lines is straightforward. When the RSX value is above the central threshold of 50, only the upper signal line is calculated, while the lower signal line value is inherited from previous calculations. Conversely, when the RSX drops below 50, the lower signal line is calculated, inheriting the value from above. This approach allows for a blend of levels and signal lines without needing to adjust the RSX value itself.
This method has its advantages, particularly when navigating trends, as it mitigates some of the issues associated with relying solely on signal lines. However, it’s crucial to conduct thorough testing to see how it performs within your trading strategy.


Comments 0