Theory:
The Simple Harmonic Oscillator (SHO) indicator is inspired by Akram El Sherbini's article, "Time Cycle Oscillators," published in the IFTA journal in 2018.
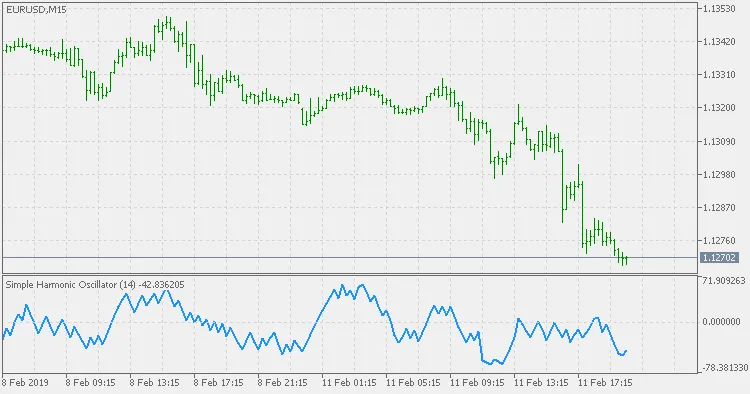
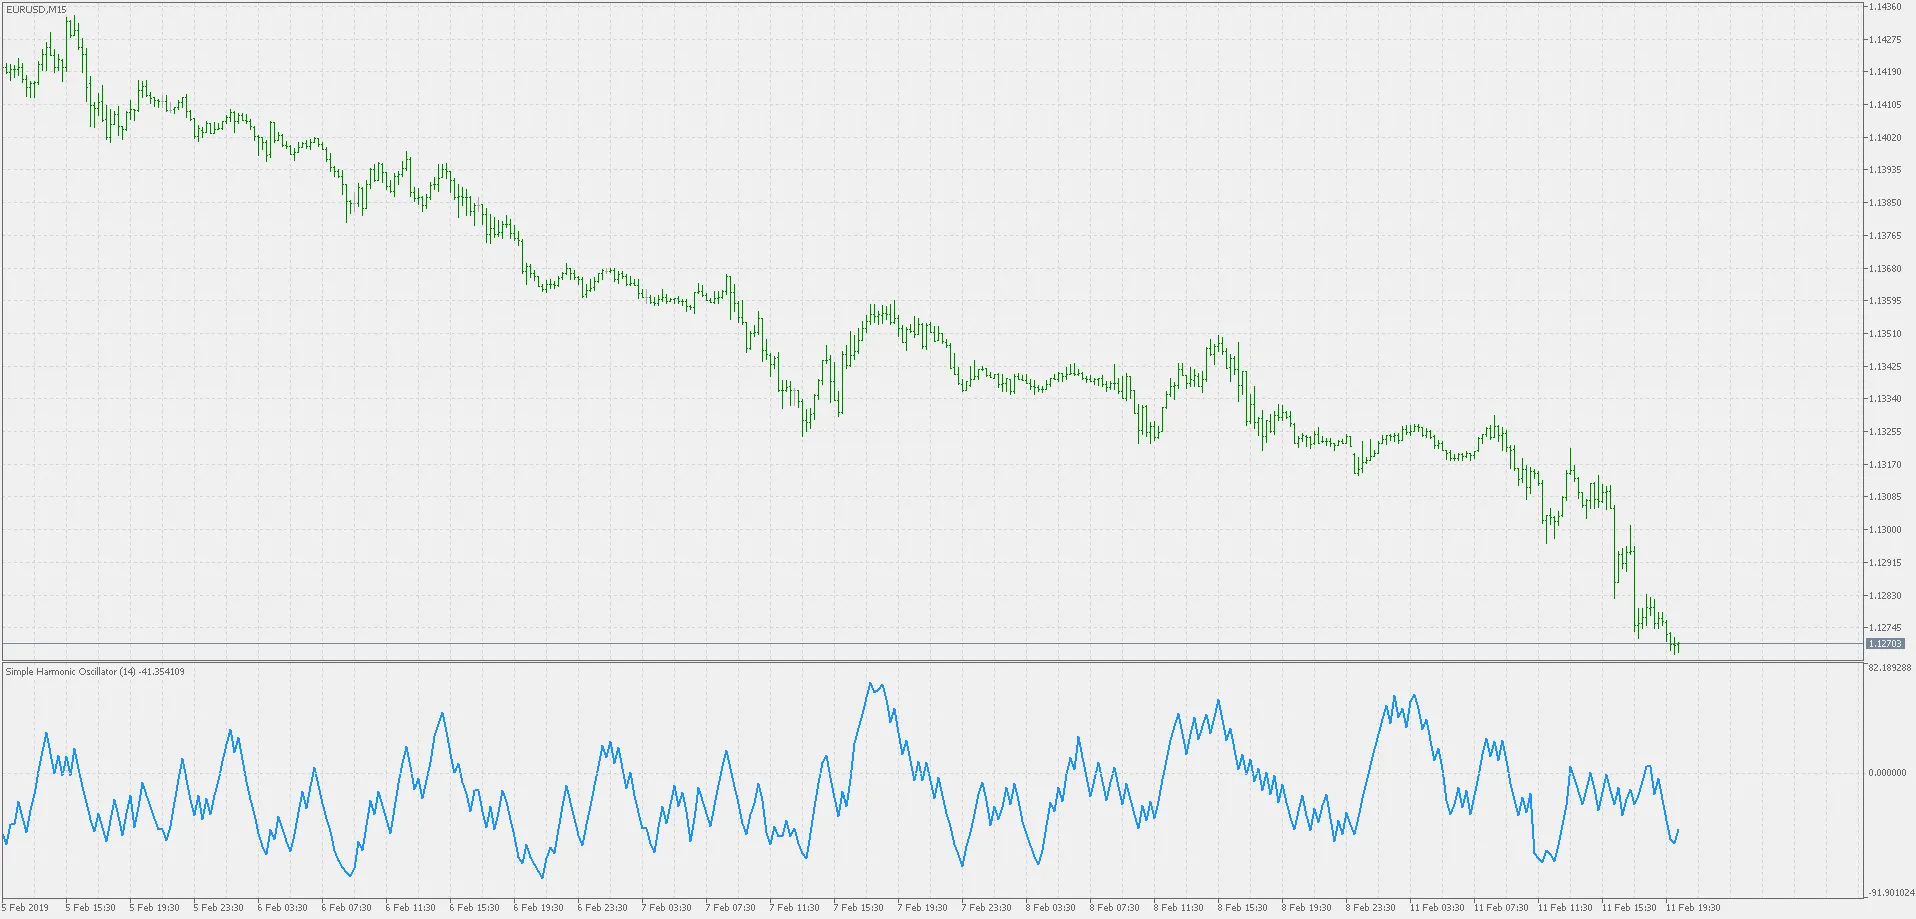
The SHO is a bounded oscillator designed to measure the market's cyclical periods. It's particularly useful for both short and intermediate trading strategies, oscillating between -100% and +100%. The key levels to watch are +40 for overbought conditions and -40 for oversold conditions. In extreme scenarios, the oscillator can hit +60 or -60. The zero point represents a balance between bull and bear market periods. In an uptrend, the SHO typically stays between 0 and +40, indicating bullish control, whereas, in downtrends, it fluctuates between 0 and -40, signaling bearish dominance. A drop to -60 during an uptrend suggests weakness, while reaching +60 in a downtrend is a sign of strength, indicating that the oscillator is unlikely to hit -40.
Usage:
Centerline Crossover StrategyThis strategy is most effective during uptrends. Buy signals trigger when the SHO crosses above its centerline, while sell signals occur when it crosses below. To confirm the uptrend, look for stocks closing above their 50-day EMA with the ADX reading above 18.Uptrend StrategyIn uptrends, bulls typically take charge, leading the oscillator to move above its centerline as the cycle periods extend. Buy signals occur when the oscillator crosses above the lower boundary or equilibrium line, while crossing above the upper boundary generates sell signals. This strategy can be combined with “Re-entry” and “Exit at Weakness” tactics, yielding three buy signals and two sell signals.Sideways StrategyDuring sideways market conditions, oscillators will fluctuate between their defined upper and lower boundaries. A cross above the lower boundary indicates a buy signal, while a drop below the upper boundary signals a sell. If the bears gain control and the oscillator crosses below the lower boundary, this triggers exit signals. Typically, this strategy results in one buy signal and two sell signals, and is identified when stocks close above their 50-day EMA with the ADX below 18.


Comments 0