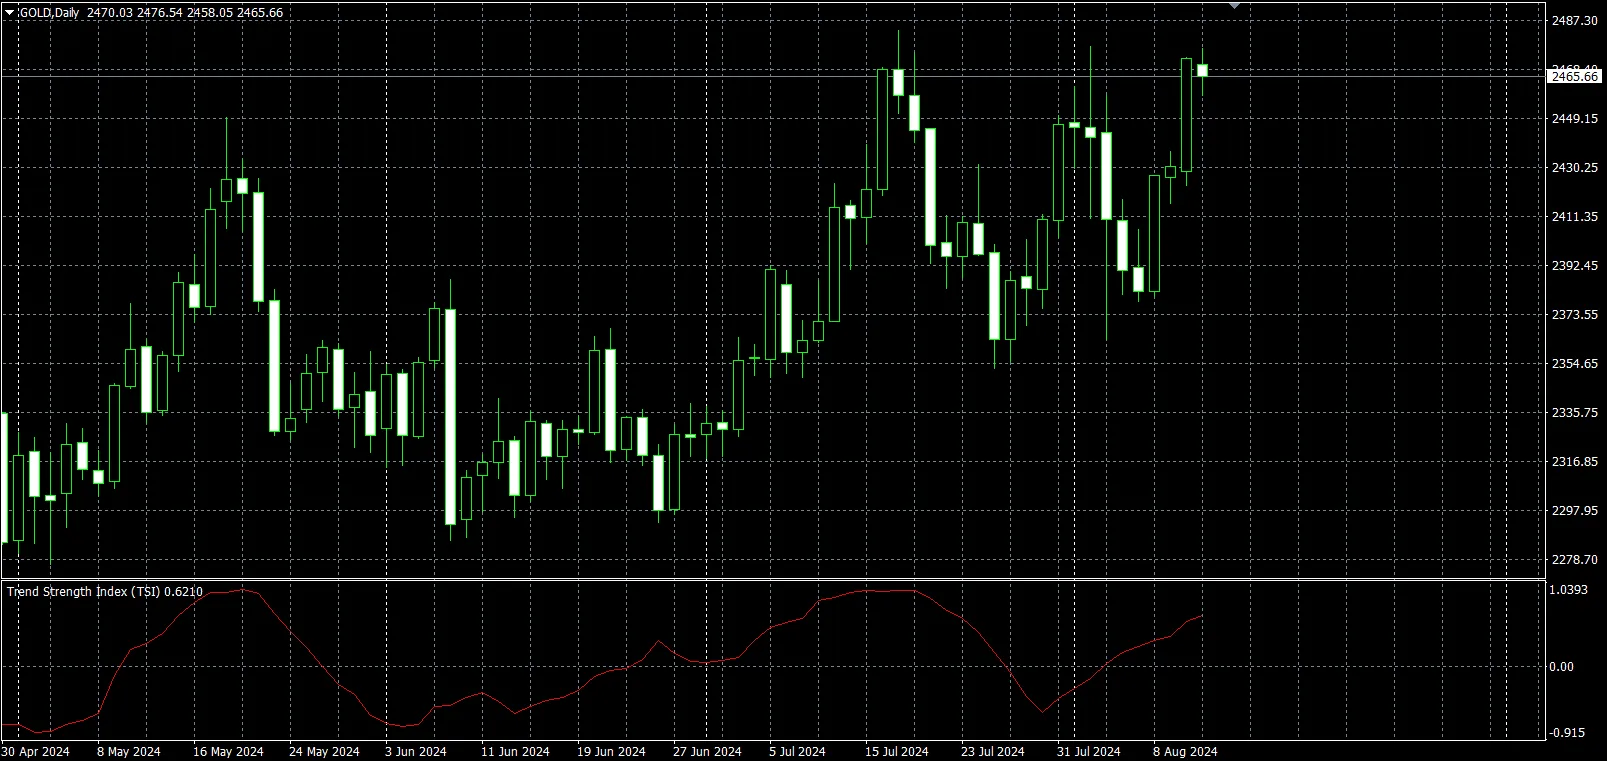
The Trend Strength Index (TSI) is a powerful tool for gauging the strength of current market trends. Think of it as a user-friendly version of an auto regression indicator. It works by calculating the Pearson correlation coefficient, which measures the relationship between two sets of data: the closing prices and the bar indices over a specified period.
So, what does this mean for you as a trader? Let’s break it down:
- A value close to 1 indicates a strong uptrend, with minimal deviation from the mean.
- A value close to -1 suggests a robust downtrend, again with small deviations from the mean.
- A value near 0 hints at a potential flat market, where price action isn’t trending strongly in either direction.
As of 08/22/24, we've also fixed an issue with the indicator not updating, ensuring you get the most accurate data to make informed trading decisions.


Comments 0