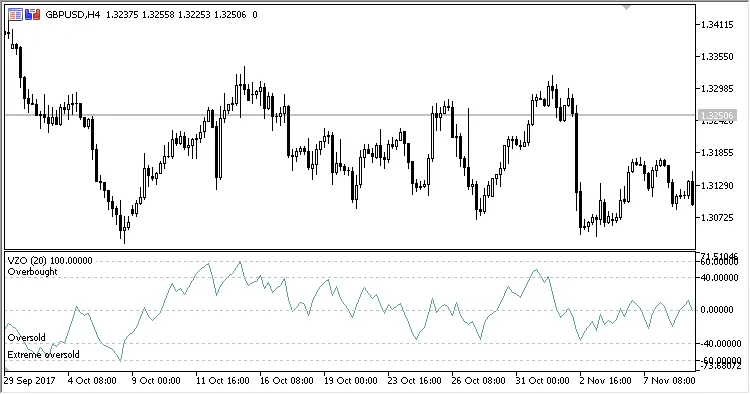
Hey fellow traders! Today, let's dive into the Volume Zone Oscillator (VZO), an oscillating indicator that helps us gauge volume in relation to price changes at each bar. This can be a game-changer in fine-tuning our trading strategies!
The VZO comes with five adjustable parameters that you can tweak to suit your trading style:
- Period - This sets the calculation period for the indicator.
- Extreme Overbought - This defines the extreme overbought level.
- Overbought - This marks the regular overbought level.
- Oversold - This indicates the oversold level.
- Extreme Oversold - This is the extreme oversold level.
Calculating the VZO:
VZO = (AvgVP / AvgVol) * 100.0
Where:
AvgVol = EMA(Volume, Period)
AvgVP = EMA(VP, Period)
- If Close > PrevClose
VP = Volume - Otherwise
VP = -Volume
Volume refers to the tick volume.
Now, here's the key part:
The oscillator value of 40 or higher indicates bullish accumulation, while -40 and below suggests bearish accumulation. A value around +/- 20 means the market is consolidating or nearing a support/resistance level. If the VZO approaches +/- 60, brace yourself for a potential end to the current bullish or bearish movement. If this shift opposes the long-term trend, the chances of a reversal increase significantly.
Happy trading, and keep an eye on that VZO!


Comments 0