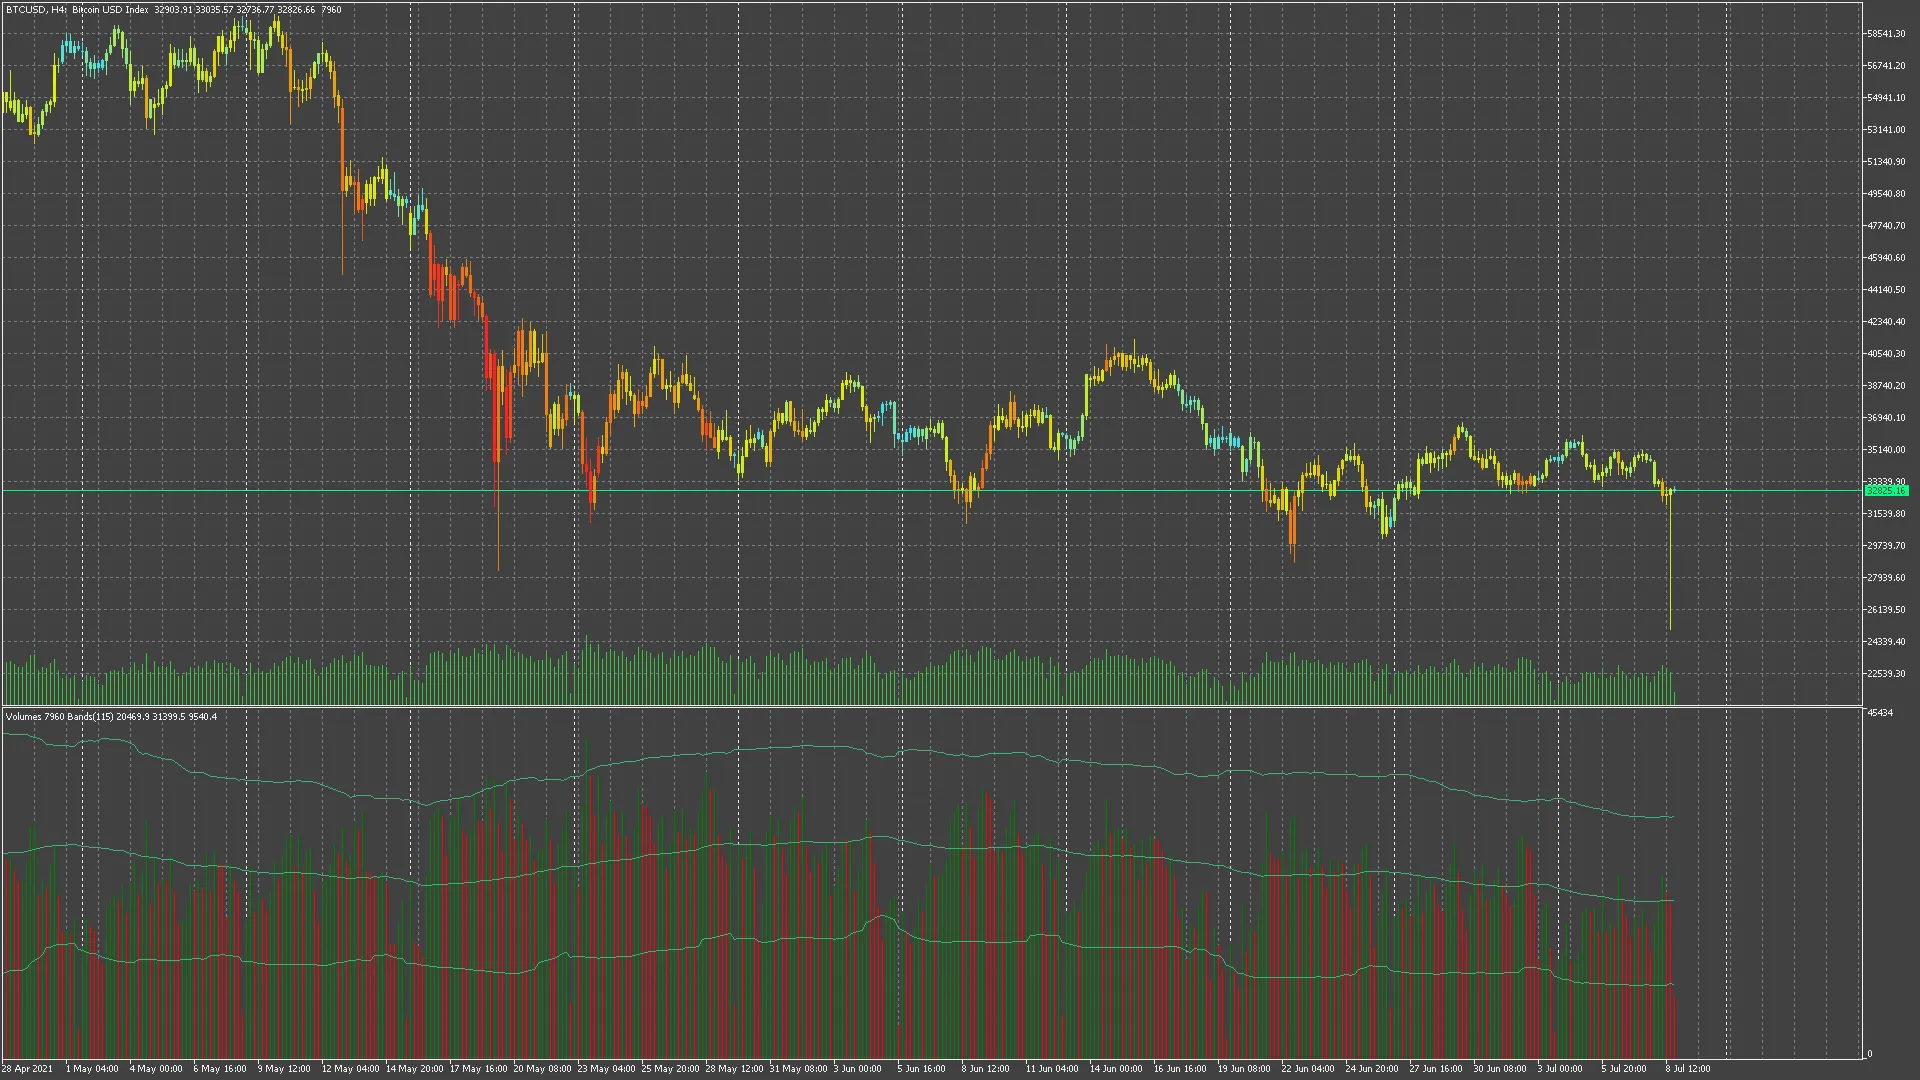
Have you ever wanted to enhance your trading experience with more insightful visuals? The Volume Colored Candlestick indicator does just that, especially when paired with Bollinger Bands for a clearer picture of market volatility.
Changelog
Here’s a quick look at the latest updates:
- v1.02b: We’ve implemented a hotfix for the static integer chartBars. This update ensures that you no longer see the same initial call value of Bars(Symbol(), PERIOD_CURRENT) repeatedly; now, it updates correctly, eliminating any invalid candles from your view.
- v1.02a: This version guarantees that invalid bars won’t show up in your chart data, effectively hiding any uncalculable bars and checking for a minimum number of bars to display.
- We’ve also addressed the issue with gradients that didn’t appear from Bar 0 until the iPeriod.


Comments 0