Welcome back, fellow traders! Today, we’re diving into the fascinating world of the Williams' Accumulation/Distribution indicator, often referred to simply as W A/D. This tool helps us gauge market sentiment by measuring the balance between buyers and sellers.
The W A/D is calculated by summing up the positive "accumulative" price movements and the negative "distributive" ones. Essentially, when we talk about "accumulation," we're looking at a market that's in the hands of buyers. Conversely, "distribution" indicates a market controlled by sellers.
So, how does it work? If today’s closing price is higher than yesterday’s, the W A/D increases by the difference between today’s closing price and the lowest price during that time frame. On the flip side, if today’s closing price is lower, the W A/D decreases by the difference between today’s closing price and the highest price.
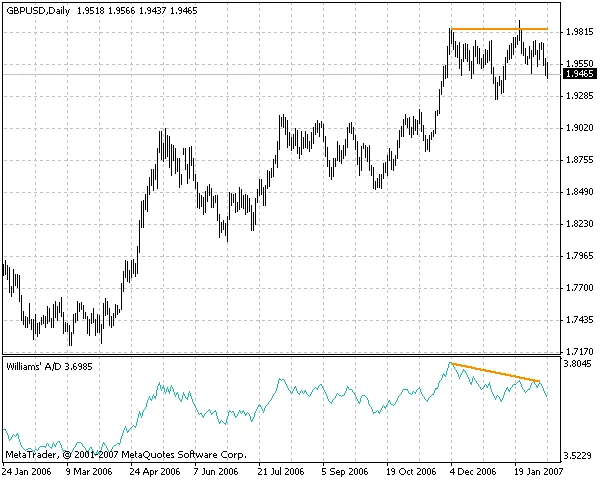
Now, let’s talk trade signals! Williams suggests watching for divergences when using this indicator:
If the price hits a new high but the W A/D doesn’t follow suit, it’s a sign that sellers are taking control—time to consider selling!
On the other hand, if prices reach a new low but the W A/D doesn’t drop, that indicates buyers are stepping in—this could be a good buying opportunity.
In conclusion, keeping an eye on the W A/D can give you valuable insights into market dynamics. It's a handy tool that can help inform your trading decisions. Happy trading, and may your charts be ever in your favor!


Comments 0