If you're looking to elevate your trading game, the Multi-Timeframe Dynamic Trend indicator for MetaTrader 5 is a must-have tool. This nifty indicator showcases the readings of three Dynamic Trend indicators across different timeframes right on your current chart.
Here’s a quick rundown of the six adjustable parameters you can tweak:
- Period - This sets the calculation period for the Dynamic Trend.
- Percent - This represents the 'strengthening percentage' of the Dynamic Trend.
- Drawing Mode - Choose how you want the indicator to draw on your chart:
- Steps - Displays the trend in steps.
- Slope - Shows the trend with sloping lines.
- First DT Timeframe - This is the timeframe for the first Dynamic Trend reading.
- Second DT Timeframe - This is for the second Dynamic Trend reading.
- Third DT Timeframe - And this one is for the third Dynamic Trend reading.
The Dynamic Trend indicator paints a two-color trend direction line and places signal pointers for easy interpretation. To filter these signals effectively, it's wise to use additional confirmation signals, like support and resistance levels.
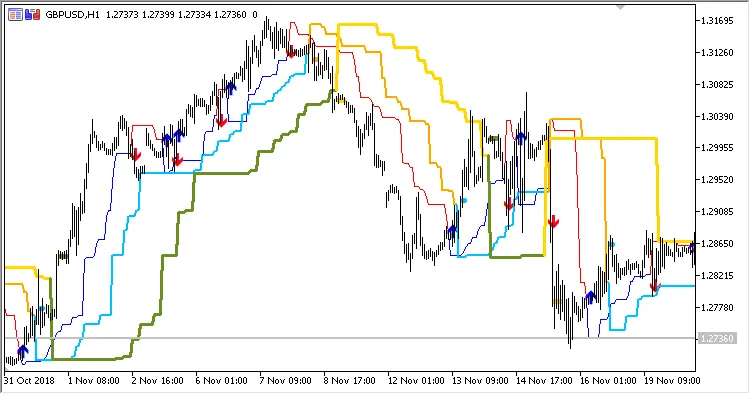
Fig. 1. Multi-Timeframe Dynamic Trend, Drawing Mode = Steps
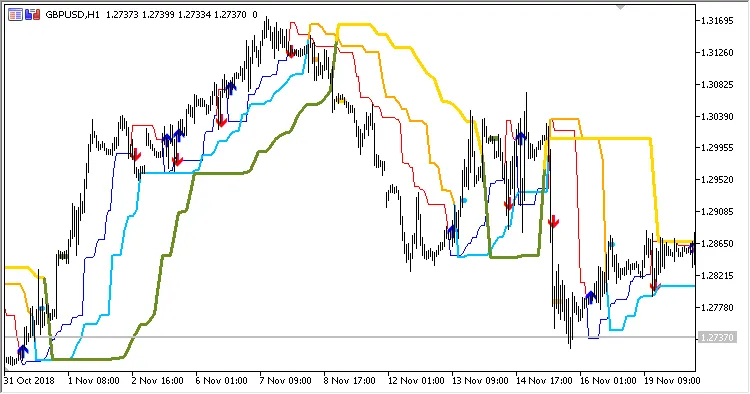
Fig. 2. Multi-Timeframe Dynamic Trend, Drawing Mode = Slope


Comments 0