Hey there, fellow traders! If you're looking to elevate your trading game, let’s talk about the Dynamic Zone RSI. This nifty indicator is not just your average Relative Strength Index (RSI); it adds a whole new layer of sophistication to your analysis.
In simple terms, the RSI is a momentum oscillator that ranges from 0 to 100. It's a key tool that helps traders gauge market sentiment. When the RSI hits high values (close to 100), it often signals that the market may be overbought, while low values (close to 0) suggest it might be oversold. This can be a powerful cue for trend changes!
What sets the Dynamic Zone RSI apart is its enhanced smoothing capabilities. This means you get clearer signals, reducing noise and helping you make more informed trading decisions.
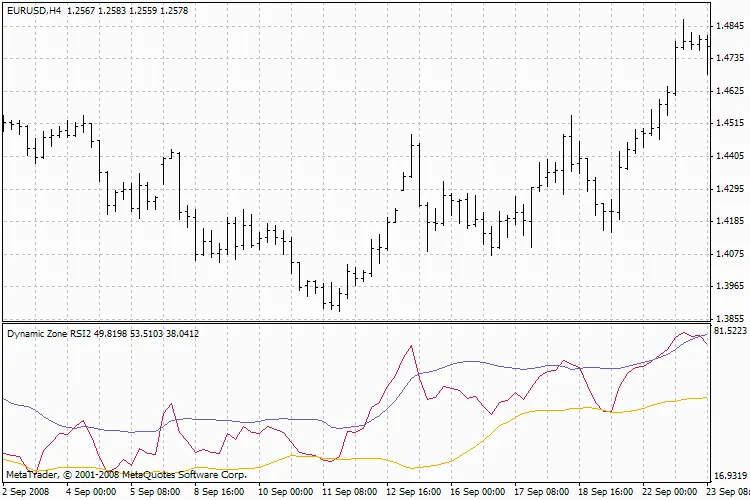
Dynamic Zone RSI
Whether you’re a seasoned trader or just starting out, incorporating the Dynamic Zone RSI into your trading strategy can provide you with valuable insights. It’s all about staying ahead of the curve, right?
Happy trading!


Comments 0