Hey there, fellow traders! If you’ve been delving into Elliott Wave theory, you might want to check out Glenn Neely's innovative approach detailed in his book, “Mastering Elliott Wave.” This method, known as the Neely Method, offers a more structured and objective way to analyze market waves.
At the heart of this technique is the concept of a Monowave. This simply refers to the price movement until it shifts direction. You can spot Monowaves by charting the high and low prices over a selected time frame, following the order they appear throughout that period.
The Neely Method breaks down into different levels, each with its own name: Monowave, PolyWave, Multiwave, and Macrowave. These levels represent various degrees of price movement, giving you a comprehensive view of the market.
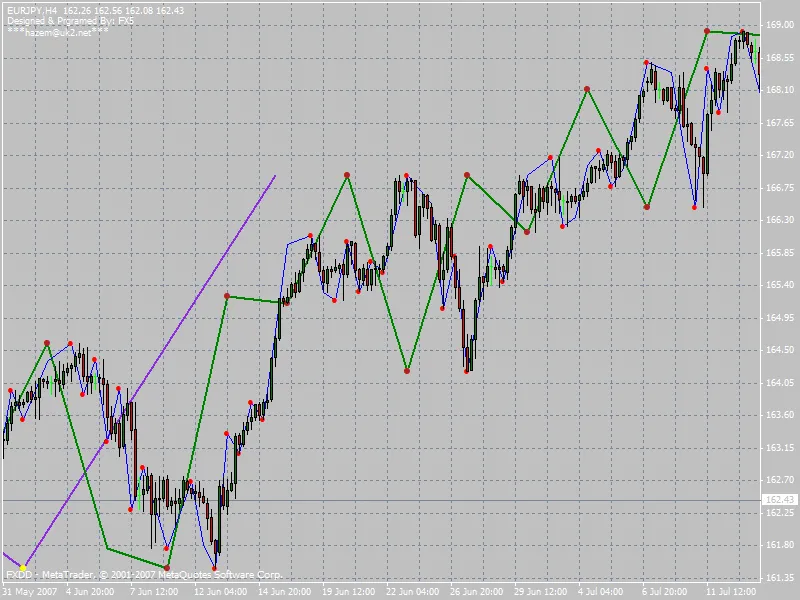
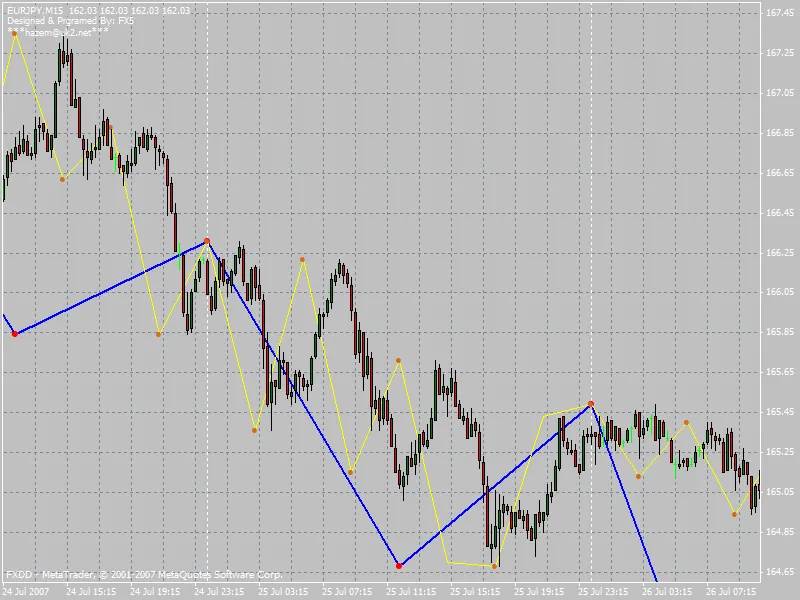
The indicator that accompanies this method plots these Monowaves across different time frames. Each Monowave’s start and end points are marked by a dot or small circle, making it easy to visualize trends. Here’s how the levels are color-coded:
- Monthly: Default color is BlueViolet.
- Weekly: Default color is Green.
- Daily: Default color is Blue.
- Quarter Daily: Default color is Yellow.
Don’t worry if you’re not a fan of these colors; you can easily customize them in the indicator’s settings to fit your preferences.
I really hope you find this indicator to be a valuable addition to your trading toolkit. Best of luck out there!


Comments 0