Understanding the HML Rainbow Indicator
If you're trading on MetaTrader 4 (MT4), you might have noticed that it has its limitations, especially when it comes to the number of lines you can draw in a single indicator. But don't fret! The HML Rainbow is a game-changer. This unique family of indicators works in harmony, drawing three distinct sets of lines that provide a comprehensive view of highs, lows, and median lines across all timeframes. This setup creates a robust framework for identifying support and resistance levels, making it an ideal tool for analyzing price movements.
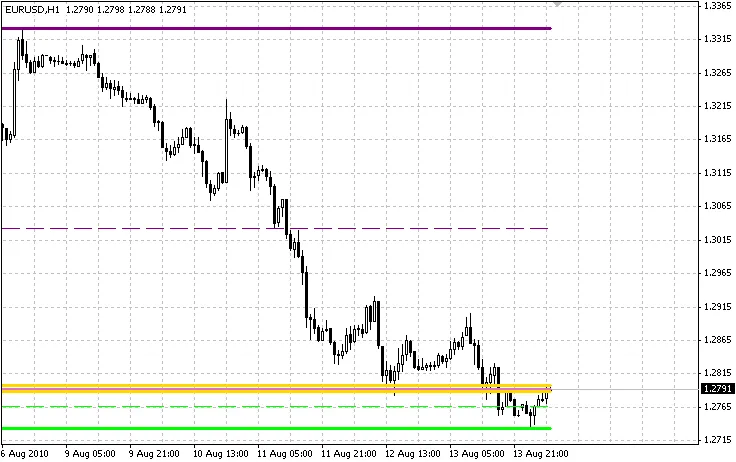
Price Levels and Resistance
Here's my take: when the price approaches a level where two or more of these lines converge, you're likely to encounter strong resistance. In most cases, the price will bounce back to a previous level. However, if the momentum is strong enough, it might just break through that resistance. Pair this with Bollinger Bands, and you might uncover some intriguing insights. I encourage you to explore this for yourself!
Limitations of the HML Rainbow
One downside to the HML Rainbow is that when multiple lines are drawn at the same price level, only the most recently drawn line is visible on your chart. I'm actively working on a solution for this, but if you open the data window, you can still see all the prices that are overlaid.
Visualizing Market Movements
Think of it like this: it’s akin to seeing a ghostly representation of each timeframe on your chart. Notice the delicate lines that move with the price? These represent the lower timeframes reacting to the current price action, or perhaps they indicate the median as smaller timeframe prices push in that direction. It’s a fascinating way to visualize market dynamics!


Comments 0