The Stochastic Overlay indicator is a fantastic tool for traders using MetaTrader 5. It enhances your chart by displaying colored candles based on the Stochastic oscillator's data.
Here’s what you need to know about its eight adjustable parameters:
- Data Stochastic Compare Mode - Choose how you want to compare Stochastic data:
- Main and Signal Lines - Color your candles based on whether the main line is above or below the signal line.
- Stochastic vs Level 50 - Determine the candle colors based on the position of the Stochastic line in relation to the 50 level.
- Current and Previous Stochastic Values - Compare the current and past values of the Stochastic line to get a sense of market direction.
- Stochastic vs OB/OS Levels - Analyze the Stochastic line against overbought and oversold levels to gauge potential reversals.
- Stochastic %K Period - Set the calculation period for the %K line.
- Stochastic %D Period - Define the calculation period for the %D line.
- Stochastic Slowing - Adjust the slowing calculation period for smoother signals.
- Stochastic Price Field - Specify which prices to use for the Stochastic calculation.
- Stochastic Method - Choose the calculation method for your Stochastic values.
- Stochastic Overbought - Set the level that indicates overbought conditions.
- Stochastic Oversold - Set the level that indicates oversold conditions.
Main and Signal Lines:
- If the main line of Stochastic is above the signal line, a bullish candle appears in green, while a bearish candle shows in light green.
- If the main line is below the signal line, expect a bearish candle in red and a bullish one in light red.
- In all other cases, the candle color will be gray.
Stochastic vs Level 50:
- If the Stochastic line is above level 50, the bullish candle is green, and the bearish candle is light green.
- If it’s below level 50, the bearish candle shows in red, and the bullish candle in light red.
- Otherwise, the candle will be gray.
Current and Previous Stochastic Values:
- If the main line values are rising, expect a bullish candle in green and a bearish one in light green.
- If the main line values are falling, the bearish candle will be red and the bullish candle light red.
- In all other scenarios, the candle will be gray.
Stochastic vs OB/OS Levels:
- If the main line is above the overbought level, a bullish candle will be green, while a bearish one will be light green.
- If it’s below the oversold level, the bearish candle shows in red and the bullish one in light red.
- In all other cases, the candle will be gray.

Fig. 1. Stochastic Overlay + Stochastic. Data Stochastic Compare mode = Stochastic's main and signal lines
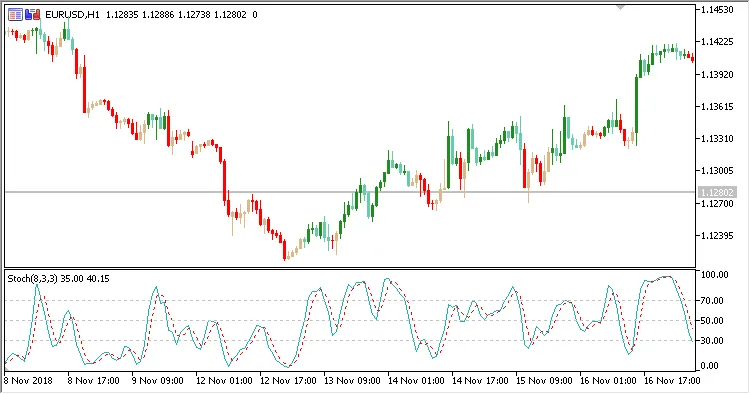
Fig. 2. Stochastic Overlay + Stochastic. Data Stochastic Compare mode = Stochastic vs level 50
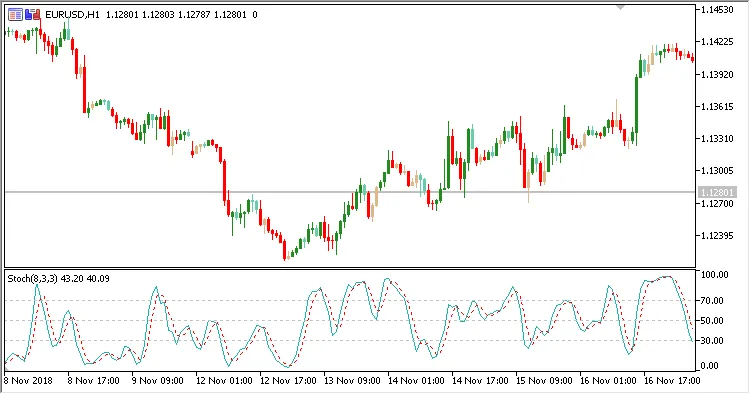
Fig. 3. Stochastic Overlay + Stochastic. Data Stochastic Compare mode = Current and previous stochastic values
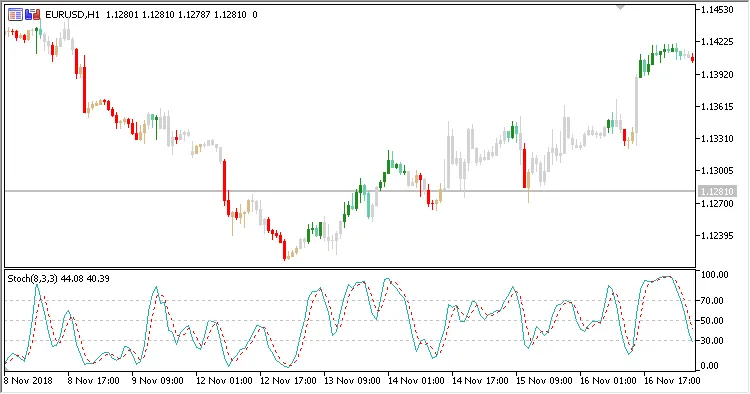
Fig. 4. Stochastic Overlay + Stochastic. Data Stochastic Compare mode = Stochastic vs OB/OS levels


Comments 0