Hey fellow traders! Today, we’re diving into the Multi-Timeframe Slow Volume Strength Index (SVSI_MTF). This nifty indicator displays data from three different SVSI indicators right on your current chart, making it easier for you to analyze multiple timeframes at a glance.
One of the best things about the SVSI_MTF is its flexibility. You have nine adjustable parameters to tailor it to your trading style:
- EMA Period: This sets the calculation period for the EMA SVSI.
- Smoothing: Adjust the SVSI smoothing period to fit your strategy.
- Overbought: Define your overbought level for precise entries.
- Middle: Set your middle line to gauge market balance.
- Oversold: Identify oversold levels to spot potential reversals.
- Drawing Mode: Choose how you want the indicator to be displayed:
- Steps: Displays as a ladder-like structure.
- Slope: Shows sloping lines for a smoother visual.
- First SVSI Timeframe: Set the timeframe for the first SVSI indicator.
- Second SVSI Timeframe: Define the timeframe for the second SVSI indicator.
- Third SVSI Timeframe: Choose the timeframe for the third SVSI indicator.
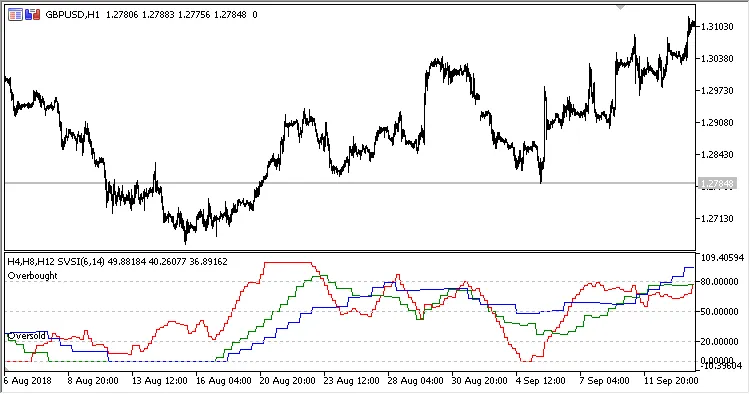
Fig.1. Multi-Timeframe Slow Volume Strength Index; H4, H8, and H12 data displayed on the H1 chart with Steps drawing mode.
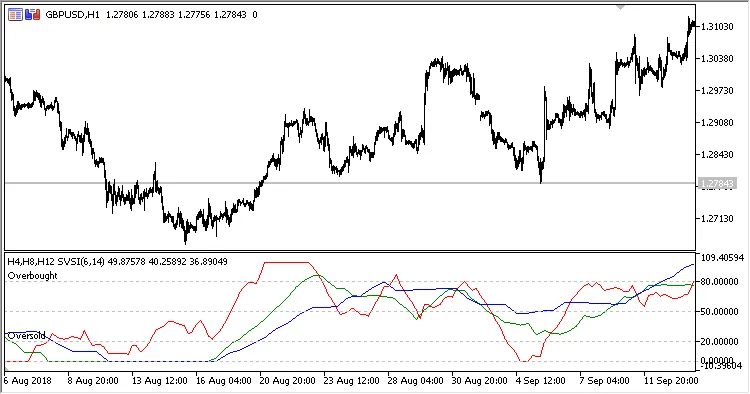
Fig.2. Multi-Timeframe Slow Volume Strength Index; H4, H8, and H12 data displayed on the H1 chart with Slope drawing mode.
With the SVSI_MTF, you can gain insights from different timeframes all in one place. It’s a powerful tool to help you make informed trading decisions. So, why not give it a try and see how it enhances your trading strategy?


Comments 0