Hey traders! If you're on the lookout for a tool to help you gauge price deviations from moving averages, let me introduce you to the MaDevOsc. This nifty indicator for MetaTrader 5 displays the maximum deviations between a moving average (MA) and the price, giving you a clearer picture of price action.
Unlike other indicators, the MaDevOsc uses a color-coded histogram in a separate window, making it visually appealing and easy to interpret. Using frames to detect these maximum values is similar to how you’d search for fractals, and it can really enhance your trading strategy.
Input Settings
The MaDevOsc comes with four key inputs that you can customize:
- Period - This determines the MA calculation period.
- Method - Choose how the MA is calculated.
- Applied Price - Select the price used in the MA calculation.
- Frames - Set the size of one frame for searching maximum deviations.
The histogram columns will help you identify maximum deviations within a frame:
- Maximum deviation down from the MA is displayed in blue.
- Maximum deviation up from the MA is shown in red.
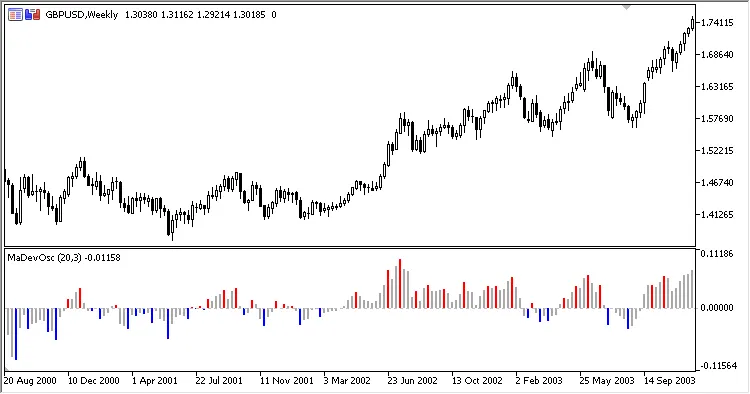
Fig. 1. Deviation from MA oscillator
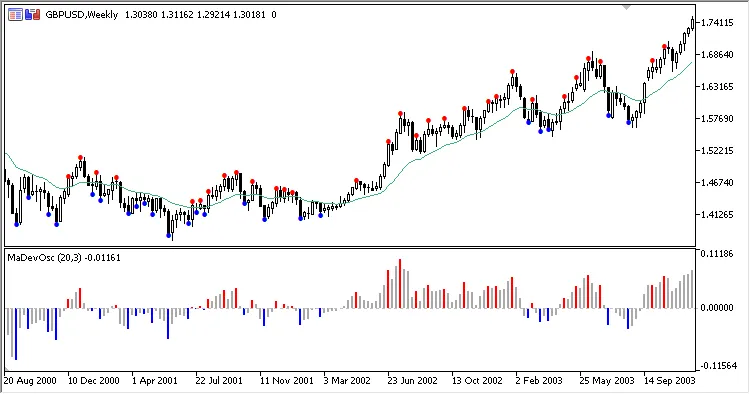
Fig. 2. Deviation from MA oscillator + Deviation from MA


Comments 0