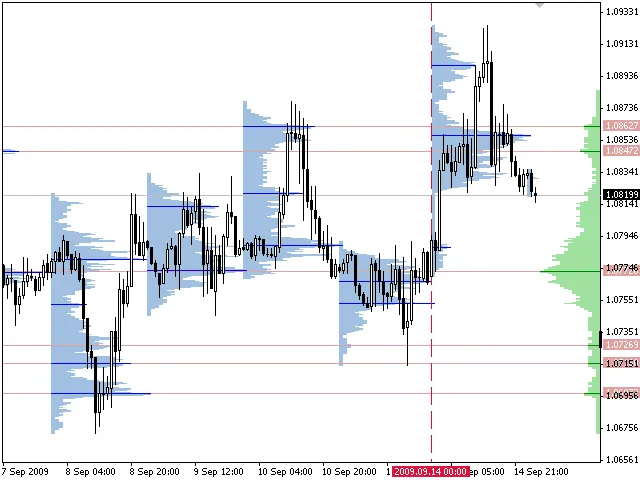
If you're serious about trading, you know that understanding market dynamics is key to making informed decisions. That's where the Volume Profile + Range v6.0 indicator for MetaTrader 5 comes into play. This powerful tool, previously known as TPO, helps you visualize the distribution of trades at various price levels over a specific time period, all displayed neatly as a histogram. The width of each bar in the histogram represents the volume of trades executed at that price level.
What’s even better? If your broker provides real volume data, this indicator can display that as well, giving you a clearer picture of market activity.
Key Features:
- VP: Shows distributions with a step equal to standard periods
- VP-Range: Displays distributions for any chosen period using various boundary-setting methods
- Customizable data display (histogram, modes, maximum)
- Run multiple indicators on a single chart
The Volume Profile (VP) breaks the chart into intervals of equal time, showing distributions for each segment. You can specify ranges that align with standard timeframes, such as H1, H4, D1, W1, and MN1. Plus, with MT5, you can access intermediate timeframes for even more flexibility.
On the other hand, the VP-Range focuses on a single range. You can define the boundaries in several ways:
- Using vertical lines to set boundaries
- By specifying the number of last chart minutes
- Setting the right border and the number of minutes to it
When you set boundaries using lines, the right border bar isn't included in the calculations. This helps maintain the integrity of data and distribution types when you switch timeframes.
It’s important to note that bars from higher timeframes might contain fewer bars from lower ones due to natural gaps in quote history, often caused by low liquidity or operational interruptions. So, if you see a week’s worth of data, the left boundary may not align perfectly with the right one. While different brokers may show variations in data, the overall results tend to be similar thanks to the vast amount of data used.
Calculation Method
The calculation method sums up the number of trades executed at a specific price. Alternatively, if you set the parameters to use real volume, it sums the volumes at that price. The trade data is interpolated using the most precise terminal data available (M1 timeframe data). This means that each bar is divided into several trades based on the anticipated price movement within the bar, making it stand out from other products that lack interpolation and rely solely on the timeframe at which the indicator is launched.
While further accuracy could be achieved by interpolating M1 data to ticks, it’s worth noting that most brokers have their own unique quote flow, which can diminish the benefits of such adjustments. However, tests show that distributions remain comparable across different brokers.
Typically, the maximums (or modes) of distributions serve as support/resistance levels. However, finding a maximum mode to determine a solid level can be tricky due to a “shading problem.” In this scenario, the next price cluster can obscure the previous one, and vice versa. Therefore, it’s crucial to analyze the chart thoroughly and set levels using VP-Range to construct distributions around the most relevant segments. Distributions over a larger range tend to carry more weight.
The version 6.0 of this indicator now allows you to specify the data source timeframe, and MetaTrader 5 even lets you use ticks provided by your broker. Check out the “Data source” parameter for more on this.
Installation
To get started, open the terminal settings (Tools > Options) and set the maximum number of bars based on how you plan to use the indicator. Remember, a day is 1,440 minutes, so if you set “Max bars in chart” to 250,000, it will be able to access data for about 173 working days, provided M1 timeframe data is available. Setting it to 65,000 will give you access for around 45 working days (just over two months).
Setting the Number of Bars
After changing the parameters, restart the terminal. Be aware that a high value for the “Max bars in chart” could slow down the terminal and require more memory, even without the indicators. Also, not all brokers provide deep chart history.
Installing the Indicator:
- Close the terminal
- Download the archive containing the indicators and unzip it
- Copy the indicator files (*.mq4 or *.mq5) into the indicator folder of your terminal. You can find the working folder in the journal when launching the terminal
- Launch the terminal
General Parameters for VP and VP-Range
| Parameter | Description |
|---|---|
| Mode step (points) | The minimum step between modes (subjectively selected for each symbol). |
| Point scale | Point scale when drawing the histogram. Higher values mean faster operation but a rougher display. |
| Volume type | Volume type (tick or real). If your broker doesn't provide real volume, the indicator won’t show anything. |
| Data source | Choose your data source:
|
| Bar style | Choose your histogram bar style:
|
| Color 1 | Histogram color 1. Set to None to match the chart's background color. |
| Color 2 | Histogram color 2. Set to None to match the chart's background color. |
| Line width | Line width when drawing the histogram. |
| Mode color (None=disable) | Color for local maximum (distribution mode). Set to None to disable. |
| Maximum color (None=disable) | Color for maximum. Set to None to disable. |
| Median color (None=disable) | Color for median. Set to None to disable. |
| VWAP color (None=disable) | Color for VWAP (volume-weighted average price). Set to None to disable. |
| Mode line width | Line width for mode. |
| Median & VWAP line style | Style for median lines and VWAP. |
| Identifier | Indicator ID; use different values for multiple instances on a single chart. |
VP Parameters
| Parameter | Description |
|---|---|
| Range period | Timeframe; only standard values from M1 to MN1 (1, 5, 15, 30, 60, 240, 1440, 10080, 43200). MT5 also allows for intermediate timeframes. |
| Range count | Number of ranges. |
| Time shift | Time shift from -12 to +12 hours with one-hour increments. |
| Draw direction | Direction for drawing the histogram - left to right or right to left. |
VP-Range Parameters
| Parameter | Description |
|---|---|
| Range mode | Method for indicating range boundaries:
|
| Range minutes | Number of minutes for RangeMode 1 and 2. |
| Histogram position | Location of the histogram:
|
| Mode level line color (None=disable) | Color of levels plotted by modes. Set to None to disable. |
| Mode level line style | Style of mode level lines. |


Comments 0