Introducing the PTB.mq5 Indicator
- Overview:
The PTB.mq5 indicator is a powerful tool for traders using the MetaTrader 5 platform. This nifty indicator calculates and displays both short-term and long-term high and low levels, along with key Fibonacci retracement levels derived from these extremes.
- Features:
- Short-Term High and Low: This feature computes the highest and lowest prices over a user-defined short length, helping you pinpoint immediate support and resistance levels.
- Long-Term High and Low: This functionality calculates the highest and lowest prices over a longer timeframe, giving you insights into broader market trends.
- Fibonacci Levels: The indicator also plots essential Fibonacci retracement levels (23.6%, 38.2%, 50%, 61.8%, and 78.6%) based on the long-term high and low. These levels are widely cherished by traders for identifying potential reversal points in the market.
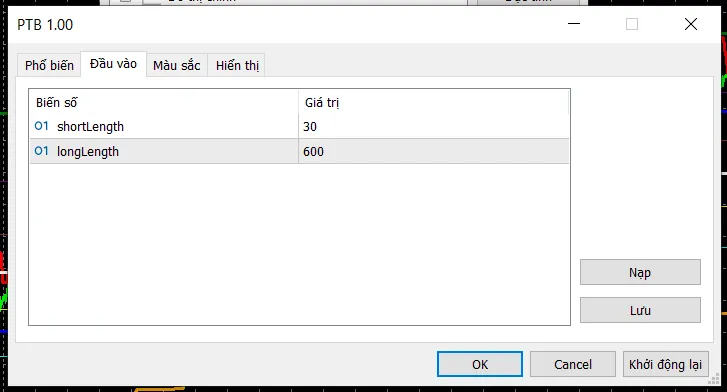
- Input Parameters:
- shortLength: Specify the number of candles to consider for calculating short-term high and low.
- longLength: Define the number of candles to consider for calculating long-term high and low.
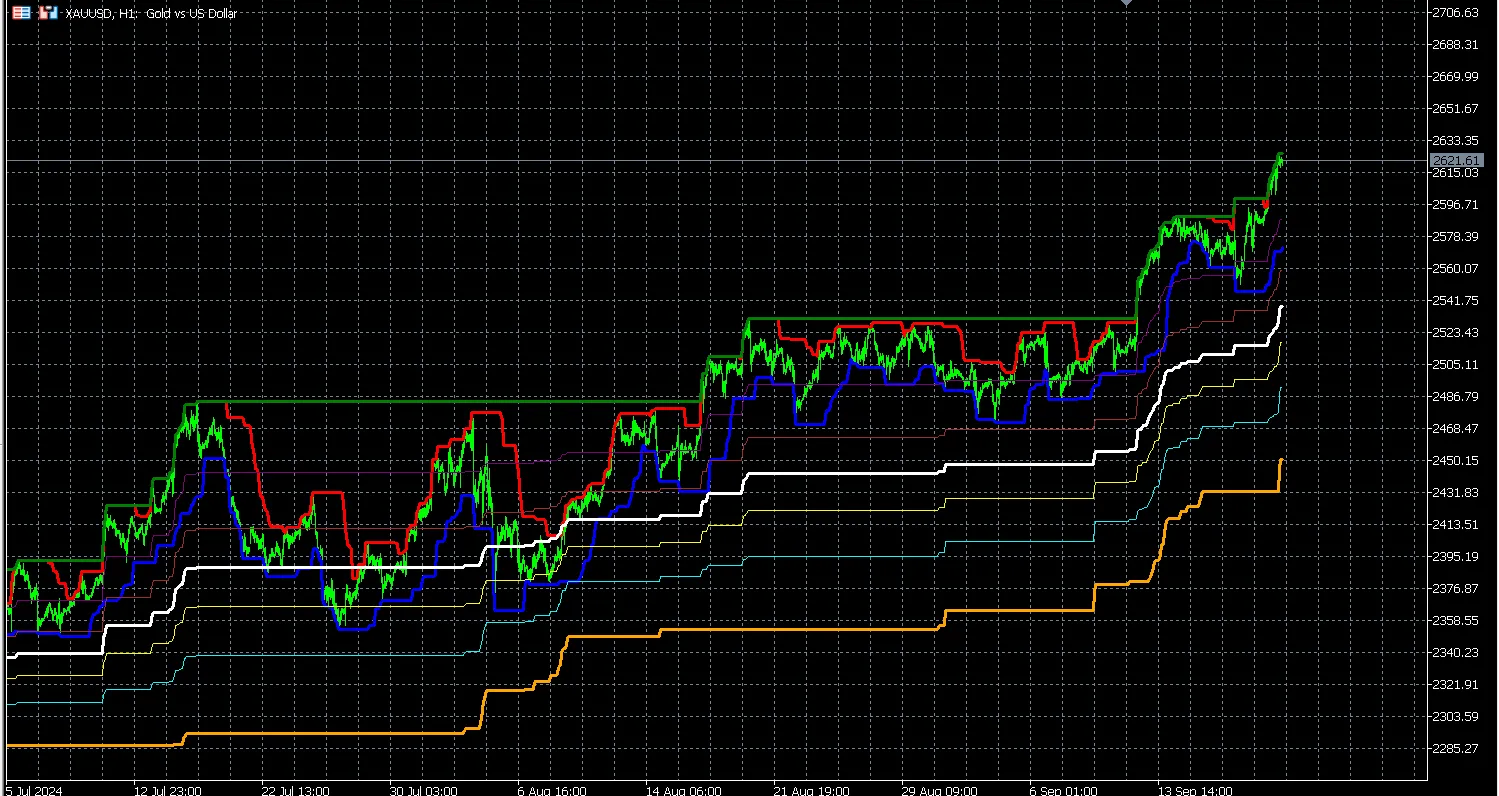
- Visual Representation:
- The indicator employs distinct colors and widths for the plotted lines:
-Short High: Red (width: 3)
- Short Low: Blue (width: 3)
- Long High: Green (width: 3)
- Long Low: Orange (width: 3)
- Fibonacci Levels:
- 78.6%: Purple (width: 1)
- 23.6%: Aqua (width: 1)
- 38.2%: Yellow (width: 1)
- 61.8%: Brown (width: 1)
- 50%: White (width: 3)
- Calculation Logic:
- The indicator systematically reviews the price data to compute the highest and lowest values for both short and long periods.
- It then calculates the Fibonacci levels based on the difference between the long-term high and low.


Comments 0