Hey fellow traders! If you're looking to step up your charting game, this nifty indicator is just what you need. It plots the open, high, low, and close (OHLC) for candles over your chosen timeframe, giving you a clear view of market movements.
What’s great about this tool is its multi-timeframe capability. You can easily plot specific OHLC levels, whether you're trading on the minute, hourly, or daily charts. It’s like having a bird's-eye view of the market!
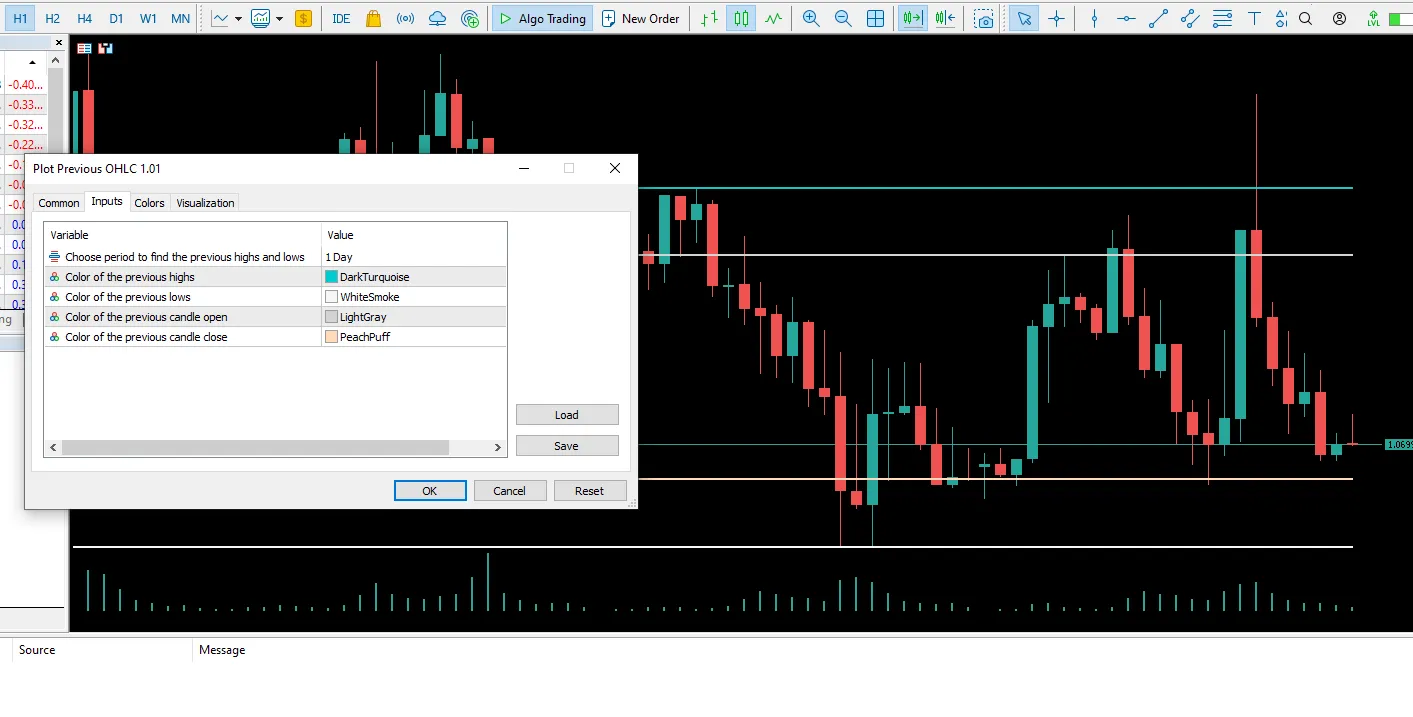
In the latest update, there’s a handy shift input feature. A shift value of 0 displays the current bar’s OHLC, while a shift of 1 takes you back one bar to show the previous candle’s data. This can really help when you're analyzing trends or looking for potential reversals.
Give this indicator a shot and enhance your trading strategy. Happy trading!


Comments 0