Symbol: EUR/USD
Timeframes: M15, H1
Indicators Used: Moving Average (200), Stochastic
For a deeper dive into this trading system, you can check out the details here.
We also have a comprehensive article on system testing available in our magazine from March 31, 2008.
Feel free to join the discussion and share your thoughts on our forum.
System Rules:
This strategy employs two charts with different timeframes (M15 and H1) alongside two key indicators: the Moving Average (period 200) and the slow Stochastic (period 14).
- Start by comparing the moving averages on both the M15 and H1 charts. A trend is confirmed if the price remains consistently above or below the moving average on both timeframes.
- Once a trend is identified, look at the M15 chart and ensure it meets these two conditions simultaneously:
- a) The price should be no more than 20 pips higher (for buying) or lower (for selling) than the moving average.
- b) The fast Stochastic line must cross the slow Stochastic line below the 20 level (for buying) or cross it from top to bottom below the 80 level (for selling).
- After entering a trade, set your Stop Loss. For long positions, position it 10 pips below the MA200 on the M15 chart. For short positions, place it 10 pips above the MA. If the price moves in your favor, adjust the stop level accordingly to secure your profits. To simplify, we recommend using a trailing stop with a step of 25 pips for each new peak or trough as shown in the examples below. (When testing the EA, we used the Bid/Ask price as the Stop Loss, not the MA200 line).
Images:
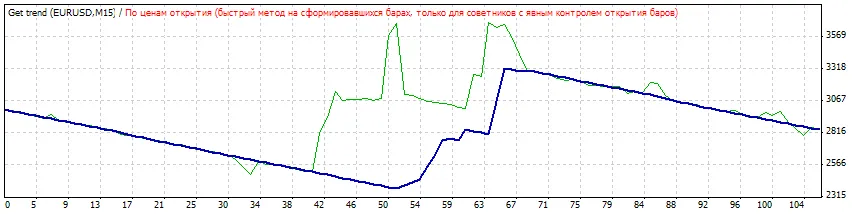
Testing the EA on EUR/USD M15 chart with standard inputs:
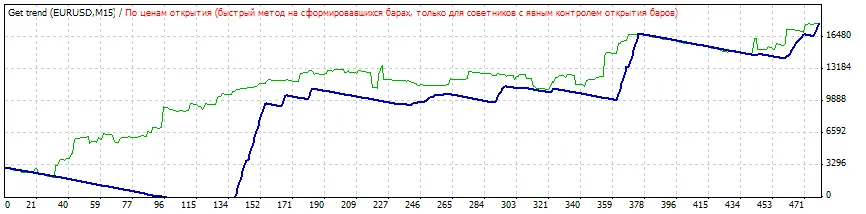
Testing the EA on EUR/USD M15 chart with optimized parameters:


Comments 0