This EA utilizes the Parabolic SAR indicator for trading strategies.
Key Details of the ytg_Parabolic_exp EA
| Trading Pair | EUR/USD (Euro vs US Dollar) | ||||
| Timeframe | 4 Hours (H4) from 02 March 2009 to 15 May 2009 | ||||
| Model | Control points (basic method, results should be taken with a grain of salt) | ||||
| Parameters | timeframe=240; step=0.009; maximum=0.2; StopLoss=100; TakeProfit=2000; Lots=10; MagicNumber=28081975; Slippage=30; NumberOfTries=5; | ||||
Performance Summary
| Bars Tested | 1326 | Ticks Modeled | 17385 | Modeling Quality | n/a |
| Mismatched Chart Errors | 25 | ||||
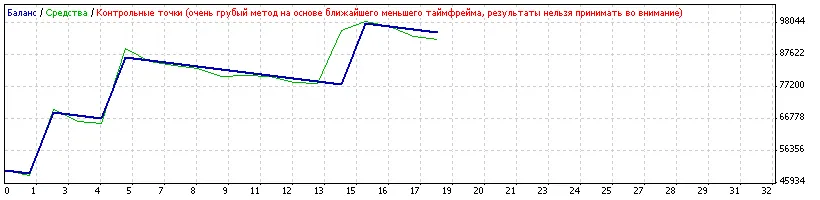
| Initial Deposit | £50,000.00 | ||||
| Total Net Profit | £44,968.00 | Gross Profit | £59,968.00 | Gross Loss | -£15,000.00 |
| Profit Factor | 4.00 | Expected Payoff | £2,498.22 | ||
| Absolute Drawdown | £1,310.00 | Maximum Drawdown | £9,782.00 (12.13%) | Relative Drawdown | 12.13% (£9,782.00) |
| Total Trades | 18 | Short Positions (Win %) | 9 (11.11%) | Long Positions (Win %) | 9 (22.22%) |
| Winning Trades (% of Total) | 3 (16.67%) | Losing Trades (% of Total) | 15 (83.33%) | ||
| Largest | Winning Trade | £20,000.00 | Losing Trade | -£1,000.00 | |
| Average | Winning Trade | £19,989.33 | Losing Trade | -£1,000.00 | |
| Maximum | Consecutive Wins (Profit) | 1 (£20,000.00) | Consecutive Losses (Loss) | 9 (-£9,000.00) | |
| Maximal | Consecutive Profits (Count of Wins) | £20,000.00 (1) | Consecutive Losses (Count of Losses) | -£9,000.00 (9) | |
| Average | Consecutive Wins | 1 | Consecutive Losses | 4 | |


Comments 0