Meet the EA Author:
Juriy from ForTrader.ru
Buying Strategy:
When the price breaks above the parabolic levels of 0.02 and 0.2, we draw Fibonacci lines between the closest minimum (before the break) and the maximum of the bar where the breakthrough occurred. This gives us a target level at 161.8% and an entry point at 50%. Don’t forget to set your stop loss just 2 pips below the last significant minimum.
Selling Strategy:
Conversely, when the price dips below the parabolic levels of 0.02 and 0.2, we draw Fibonacci lines from the nearest significant maximum (before the break) to the minimum of the bar where the breakthrough took place. This helps us identify a target at 161.8% and an entry point at 50%. Place your stop loss 2 pips above the last significant maximum to manage risk effectively.
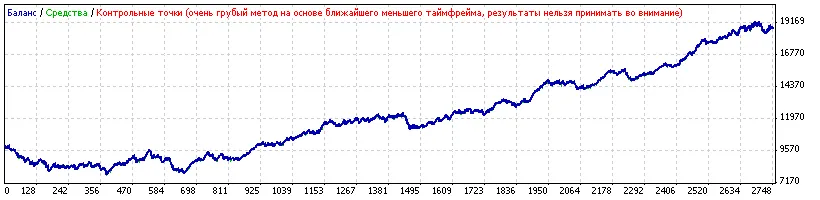
Check Out the Strategy Visual:
Helpful Tips:
- This EA is designed to work best on the M15 EUR/USD chart.
- For those interested in the coding aspects, you can find some functions used in the EA described in my blog on programming in MQL4.
- For a more in-depth look at the strategy, check out the forum discussion and the analysis featured in the 38th issue of the journal.


Comments 0