If you're looking to enhance your trading strategy, let’s dive into the RSI_Test EA designed for MetaTrader 4. This expert advisor is tailored to help you make informed trading decisions using the Relative Strength Index (RSI).
The RSI indicator plays a crucial role in this system. We initiate a buy when the RSI value falls below the specified BuyOp level and the current value exceeds the previous one. Conversely, we sell when the RSI value surpasses the SellOp level and the current value dips below the last one.
The RSI period, referred to as Test, is optimized daily to ensure your strategy remains relevant. The trailing stop mechanism implemented here is sourced from community forums, particularly Alpari, although I can't recall the exact source. Additionally, the auto-optimizer feature is inspired by the article on Automated Optimization of a Trading Robot in Real Trading.
For optimization, the key parameters are: BuyOp, SellOp, and Test.
It's worth noting that this system performs exceptionally well on the M1 timeframe, especially with the EURJPY currency pair.
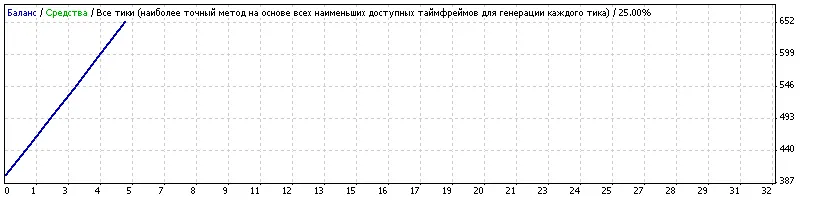
Strategy Tester Report
RSI_TestAlpari-Classic (Build 218)
| Symbol | EURJPY (Euro vs Japanese Yen) | ||||
| Period | 1 Minute (M1) 2008.10.17 00:00 - 2008.10.17 22:59 | ||||
| Model | Every tick (the most precise method based on all available least timeframes) | ||||
| Parameters | TakeProfit=50; Lots=0.1; RiskPercentage=10; TrailingStop=50; MaxOrders=1; BuyOp=29; SellOp=74; magicnumber=777; Test=11; SetHour=0; SetMinute=10; | ||||
| Bars in test | 2380 | Ticks modelled | 33018 | Modelling quality | 25.00% |
| Missmatched charts errors | 0 | ||||
| Initial deposit | £400.00 | ||||
| Total net profit | £254.46 | Gross profit | £254.46 | Gross loss | £0.00 |
| Profit factor | Expected payoff | £50.89 | |||
| Absolute drawdown | £39.31 | Maximum drawdown | £87.46 (17.25%) | Relative drawdown | 17.25% (87.46) |
| Total trades | 5 | Short positions (% won) | 3 (100.00%) | Long positions (% won) | 2 (100.00%) |
| Profit trades (% of total) | 5 (100.00%) | Loss trades (% of total) | 0 (0.00%) | ||
| Largest | profit trade | £52.07 | loss trade | £0.00 | |
| Average | profit trade | £50.89 | loss trade | £0.00 | |
| Maximum | consecutive wins (profit in money) | 5 (£254.46) | consecutive losses (loss in money) | 0 (£0.00) | |
| Maximum | consecutive profit (count of wins) | £254.46 (5) | consecutive loss (count of losses) | 0.00 (0) | |
| Average | consecutive wins | 5 | consecutive losses | 0 | |
| № | Time | Type | Order | Volume | Price | S / L | T / P | Profit | Balance |
| 1 | 2008.10.17 00:32 | buy | 1 | 0.10 | 136.65 | 0.00 | 0.00 | ||
| 2 | 2008.10.17 02:11 | modify | 1 | 0.10 | 136.65 | 137.15 | 0.00 | ||
| 3 | 2008.10.17 02:24 | s/l | 1 | 0.10 | 137.15 | 137.15 | 0.00 | £49.13 | £449.13 |
| 4 | 2008.10.17 06:34 | sell | 2 | 0.10 | 137.07 | 0.00 | 0.00 | ||
| 5 | 2008.10.17 09:02 | modify | 2 | 0.10 | 137.07 | 136.54 | 0.00 | ||
| 6 | 2008.10.17 09:03 | s/l | 2 | 0.10 | 136.54 | 136.54 | 0.00 | £52.07 | £501.20 |
| 7 | 2008.10.17 11:18 | buy | 3 | 0.10 | 135.63 | 0.00 | 0.00 | ||
| 8 | 2008.10.17 15:59 | modify | 3 | 0.10 | 135.63 | 136.13 | 0.00 | ||
| 9 | 2008.10.17 16:02 | s/l | 3 | 0.10 | 136.13 | 136.13 | 0.00 | £49.13 | £550.33 |
| 10 | 2008.10.17 17:07 | sell | 4 | 0.10 | 136.74 | 0.00 | 0.00 | ||
| 11 | 2008.10.17 17:38 | modify | 4 | 0.10 | 136.74 | 136.21 | 0.00 | ||
| 12 | 2008.10.17 17:38 | s/l | 4 | 0.10 | 136.21 | 136.21 | 0.00 | £52.06 | £602.39 |
| 13 | 2008.10.17 19:26 | sell | 5 | 0.10 | 137.03 | 0.00 | 0.00 | ||
| 14 | 2008.10.17 20:24 | modify | 5 | 0.10 | 137.03 | 136.50 | 0.00 | ||
| 15 | 2008.10.17 20:24 | s/l | 5 | 0.10 | 136.50 | 136.50 | 0.00 | £52.07 | £654.46 |
Keep in mind, this EA is not participating in any championship due to its auto-optimization feature. Although it could be utilized in such competitions, the concept was developed after the championship began.
So, whether you’re a seasoned trader or just starting out, the RSI_Test EA could give you that edge you’re looking for in the fast-paced world of trading!


Comments 0