설명:
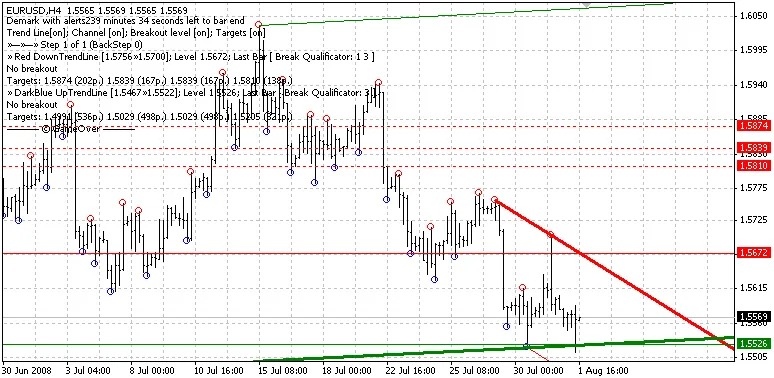
이 EA(전문가 어드바이저)는 유명한 데마크 라인 지표를 기반으로 하여 자동으로 추세선을 그려줍니다. 신호가 발생할 때마다 서로 다른 설정으로 4개의 주문을 실행하며, 필요 시 반전도 가능합니다.
데마크 라인 파일은 인디케이터 디렉토리에, DemarkLinesEA 파일은 전문가 디렉토리에 넣어주셔야 합니다.
추천 사항:
먼저 데모 계좌에서 테스트해보세요.
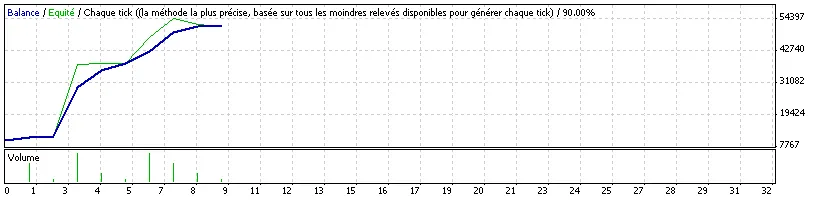
전략 테스트 보고서
DemarkLinesEA
InterbankFX-데모 계좌 (Build 217)
| 종목 | EURUSD (유로와 미국 달러) | ||||
| 기간 | 4시간 (H4) 2008.07.25 00:00 - 2008.08.01 12:00 (2008.07.25 - 2008.08.30) | ||||
| 모델 | 각 틱 (가장 정확한 방법으로 모든 최소 기록 기반) | ||||
| 파라미터 | Reverse=false; TradeOrder1=true; TradeComment1="Trade1"; TradeLots1=15; TradeSL1=30; TradeTS1=50; TradeTP1=0; TradeOrder2=true; TradeComment2="Trade2"; TradeLots2=10; TradeSL2=50; TradeTS2=80; TradeTP2=0; TradeOrder3=true; TradeComment3="Trade3"; TradeLots3=5; TradeSL3=80; TradeTS3=120; TradeTP3=0; TradeOrder4=true; TradeComment4="Trade4"; TradeLots4=2; TradeSL4=120; TradeTS4=160; TradeTP4=0; TradeAtCloseBar=true; TrailingStop=0; TrailingStep=1; BreakEven=0; MagicNumber=0; Repeat=3; Periods=5; UseAlert=false; SendEmail=true; TradeLog="DemarkLinesEA"; Slippage=3; Indicator_Setting="---------- Indicator Setting"; showBars=3000; LevDP=2; qSteps=1; BackStep=0; startBar=0; TrendLine=false; HorizontLine=false; ChannelLine=false; TakeLines=false; Comments=false; Trend=0; ShowArrows=true; CustomFeatures=true; UpTrendColor=Green; DownTrendColor=Red; TrendlineWidth=3; ShowAlerts=false; EmailAlert=false; | ||||
| 테스트 바 | 1034 | 모델링된 틱 | 46452 | 모델 품질 | 90.00% |
| 그래프 오류 | 0 | ||||
| 초기 자본 | 10,000.00 | ||||
| 총 순익 | 41,626.40 | 총 수익 | 41,626.40 | 총 손실 | 0.00 |
| 수익률 | 예상 수익 | 4,625.16 | |||
| 절대 하락 | 1,020.00 | 최대 하락 (%) | 11,400.00 (18.09%) | 상대적 하락 | 39.57% (6,513.80) |
| 총 거래 건수 | 9 | SHORT 포지션 승률 % | 3 (100.00%) | LONG 포지션 승률 % | 6 (100.00%) |
| 거래 수익 (% 총액) | 9 (100.00%) | 거래 손실 (% 총액) | 0 (0.00%) | ||
| 최대 거래당 | 수익 | 18,000.00 | 손실 | 0.00 | |
| 평균 | 수익 거래당 | 4,625.16 | 손실 거래당 | 0.00 | |
| 최고 | 연속 수익 ($) | 9 (41,626.40) | 연속 손실 ($) | 0 (0.00) | |
| 최대 | 연속 수익 (승 수) | 41,626.40 (9) | 연속 손실 (패 수) | 0.00 (0) | |
| 평균 | 연속 수익 | 9 | 연속 손실 | 0 | |


댓글 0