Hey there, fellow traders! Today, I'm excited to introduce you to a powerful tool I developed called the Adaptive Volatility Analysis (AVA) Indicator. This isn't just another run-of-the-mill indicator; it's designed to give you a sharper insight into market price movements. Unlike traditional indicators that provide a one-size-fits-all view, the AVA adapts its analysis based on the current market dynamics. This makes it a game-changer for forecasting shifts toward higher volatility or calmer trading periods. Plus, it works seamlessly with genetic algorithms, enhancing your trading strategies even further.
How It Works:
Starting With ATR: At the heart of the AVA Indicator is the Average True Range (ATR). This essential metric measures market movement over a set number of past trades, with 14 trades being the default. It’s a fantastic starting point for gauging volatility.
Smoothing with EMAs: The AVA utilizes two Exponential Moving Averages (EMAs) on the ATR values—a short-term EMA (default set to 2) and a long-term EMA (default set to 5). For those of you who prefer longer-term analysis, you can easily adjust these to 10 and 50. These EMAs help smooth out the ATR readings, making it much easier to spot trends in price movement.
The FAV Ratio: The crux of the AVA Indicator is the FAV (Factor of Adaptive Volatility). We calculate this by dividing the short-term EMA by the long-term EMA of ATR values. This ratio fine-tunes the indicator's sensitivity to market changes, making sure you’re responsive to both subtle shifts and significant market swings.
Determining AVA Value: The AVA value is calculated by adjusting the FAV ratio—simply subtract 1 from the FAV and multiply by 100. This gives you a percentage representing the current market volatility level.
Exact Calculation:
Where:
FAV = EMA_short(ATR) / EMA_long(ATR)
Usage Guidelines:
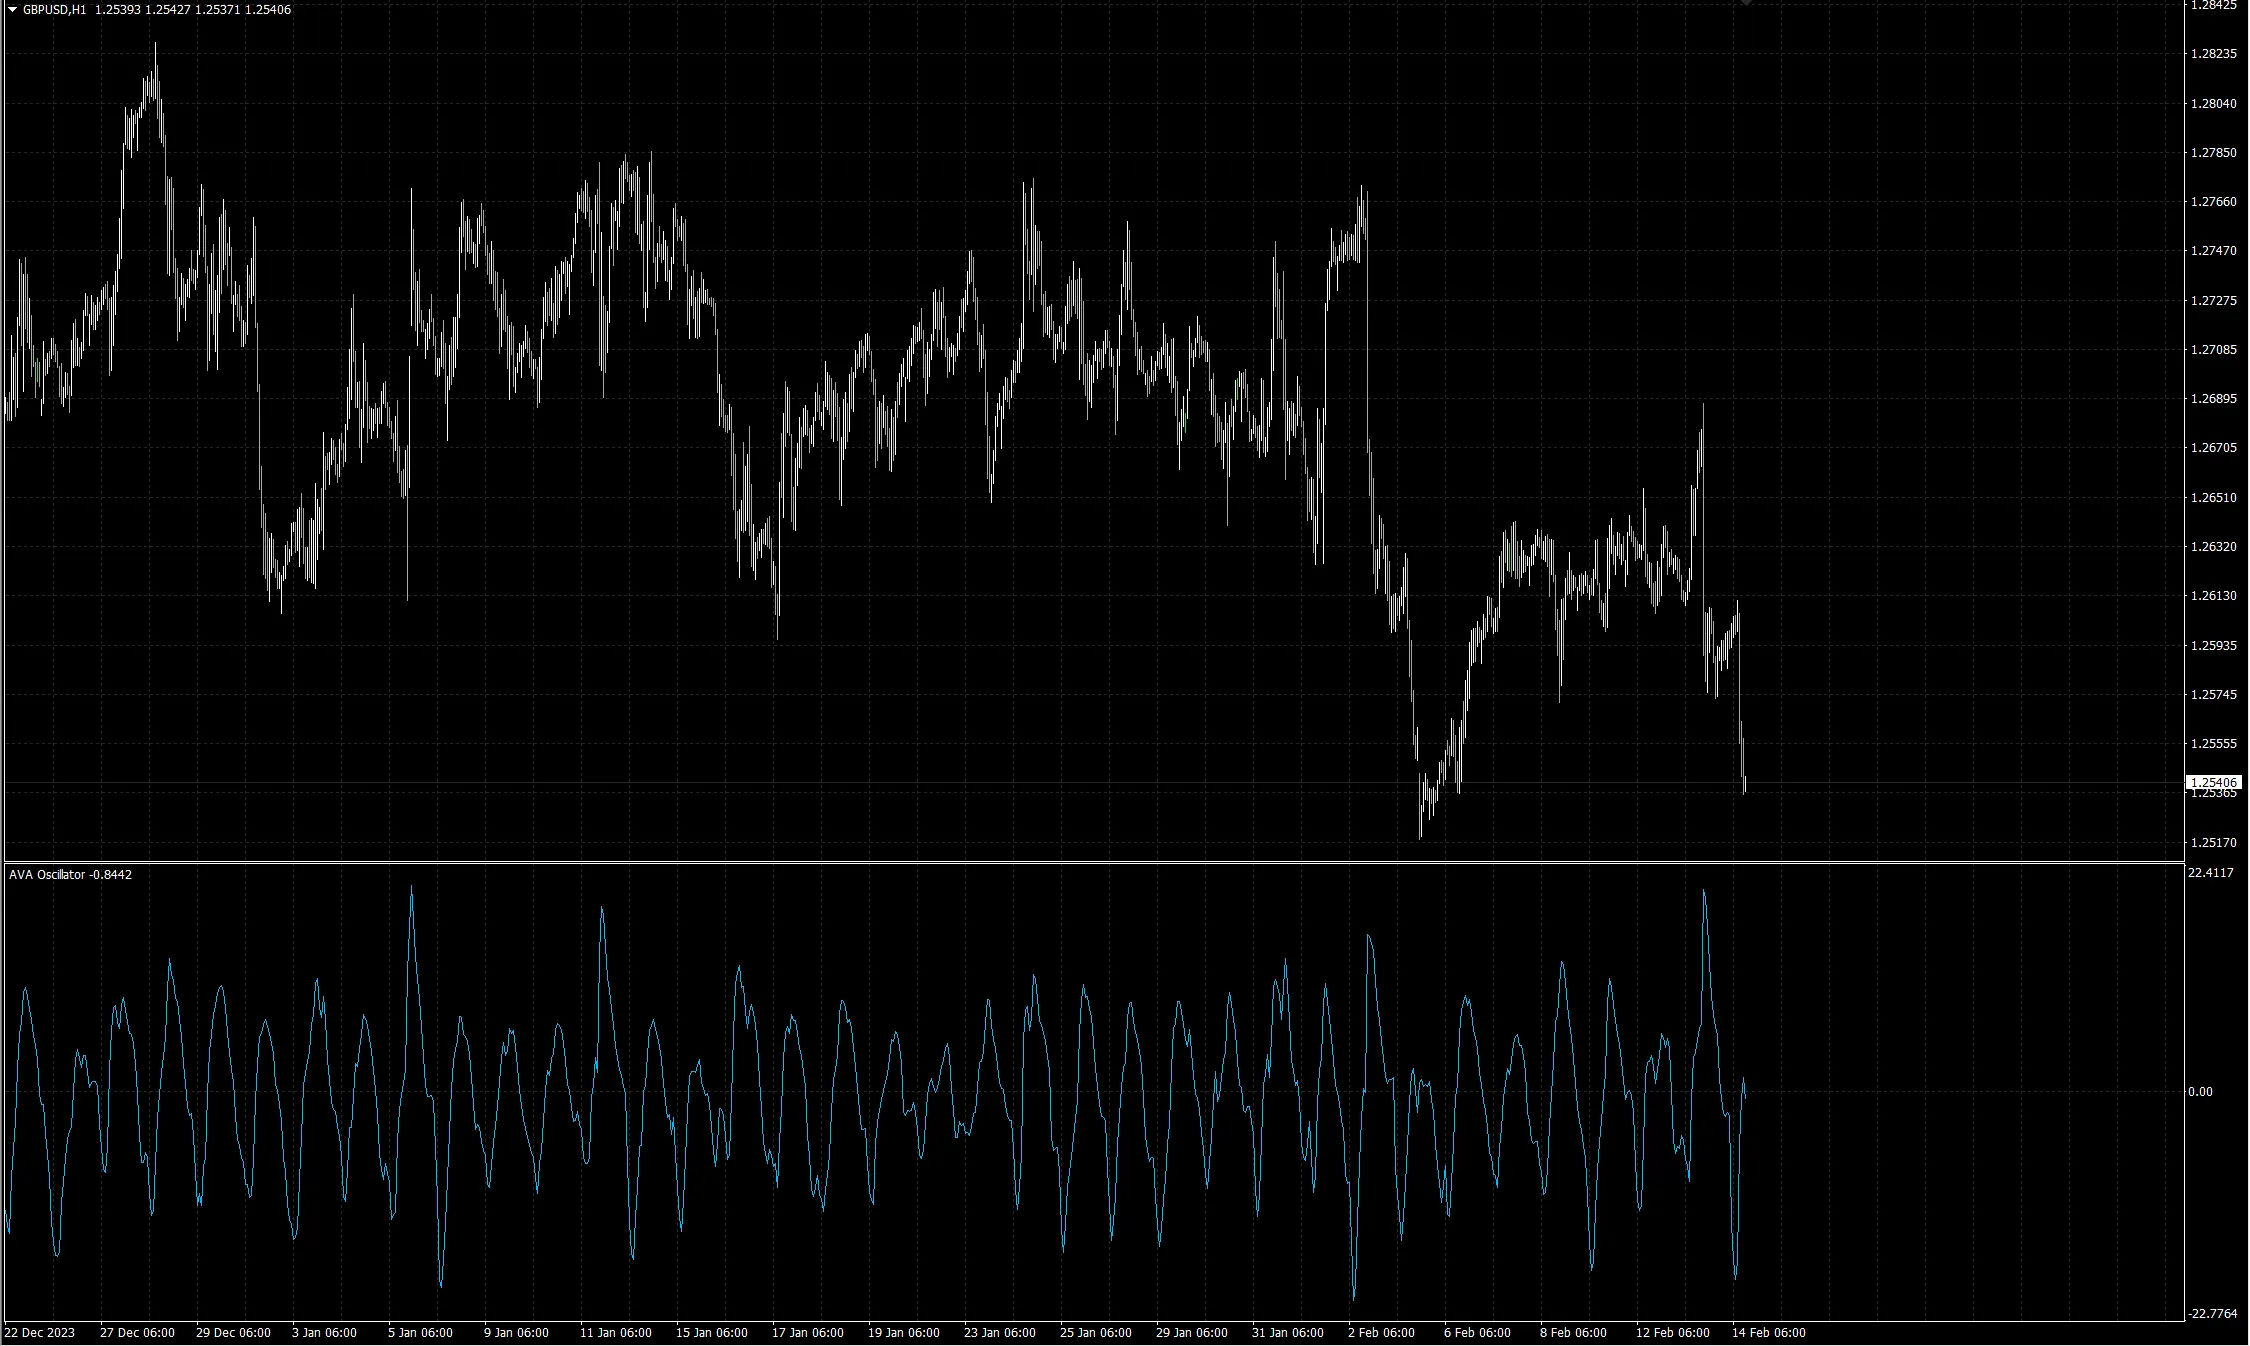
Interpreting the Indicator: The AVA Indicator shows up in a separate chart beneath your main trading chart. If you see the AVA value rising, that’s a sign of increasing volatility. On the flip side, a decreasing value indicates a calmer market.
Application Insights: In times of rising volatility, think about strategies that leverage those big price swings. Conversely, when volatility is low, it might be wise to hold off for clearer signals or adopt strategies that work better in stable conditions.


Comments 0