If you're looking to sharpen your trading game, the Pivot Lines TimeZone indicator for MetaTrader 5 is a must-have. This indicator, crafted by the talented Alejandro Galindo and published by Scriptor, brings powerful pivot analysis right to your charts. You can check out the source here.
How It Works
This nifty tool draws various levels: the main Pivot levels, sublevels, and Camarilla levels, giving you a comprehensive view of market structure.
You can choose to display these levels using indicator buffers, which cover the entire history, or opt for horizontal lines to show only the current levels.
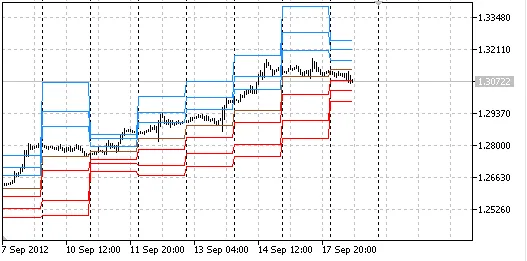
Visualizing levels with indicator buffers.
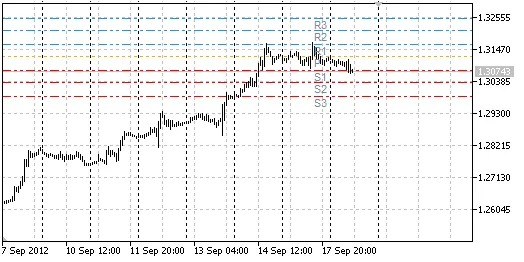
Current levels displayed with horizontal lines.
Parameters You Need to Know
- DayStartHour: Set the hour when your trading day starts.
- DayStartMinute: Specify the minute when your trading day kicks off.
- PivotsBuffers: Choose to draw Pivot levels using indicator buffers.
- MidpivotsBuffers: Draw Pivot sublevels with indicator buffers.
- CamarillaBuffers: Visualize Camarilla levels using buffers.
- PivotsLines: Display current Pivot levels with horizontal lines.
- MidpivotsLines: Show current Pivot sublevels as horizontal lines.
- CamarillaLines: Render current Camarilla levels with horizontal lines.
- ClrPivot: Choose the color for the Pivot horizontal line.
- ClrS: Define colors for S1, S2, S3 horizontal lines.
- ClrR: Set colors for R1, R2, R3 horizontal lines.
- ClrM: Pick colors for M0, M1, M2, M3, M4, M5 horizontal lines.
- ClrCamarilla: Select the color for Camarilla horizontal lines.
- ClrTxt: Choose the color for text labels on horizontal lines.
- AttachSundToMond: Attach Sunday bars to Monday's trading.


Comments 0