The Mass Index is a handy tool for traders looking to identify potential trend reversals based on shifts in the price bandwidth. Essentially, when the bandwidth widens, the Mass Index climbs, and when it narrows, the index dips.
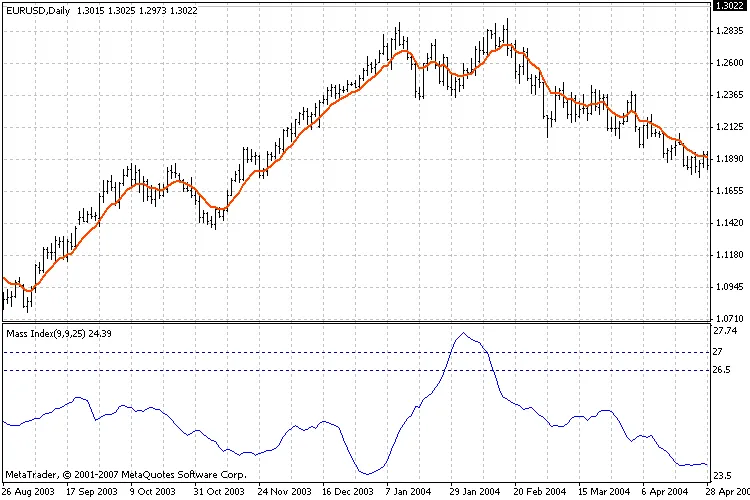
Originally developed by Donald Dorsey, the Mass Index is all about spotting a particular pattern known as the 'reversal bulge.' This occurs when the 25-period Mass Index first breaks above 27 and then drops below 26.5. At this point, there's a good chance we'll see a price reversal, regardless of whether the market is trending up, down, or bouncing around in a range.
To figure out whether to buy or sell when a reversal bulge pops up, many traders lean on the 9-period exponential moving average (EMA) of prices. If you see that reversal bulge and the EMA is trending down, it’s time to buy, betting on that turnaround. Conversely, if the EMA is on the rise, you’ll want to sell.


Comments 0