Hey there, fellow traders! If you're diving into the world of technical analysis, you've likely come across the RSI indicator. But have you explored the potential of RSI histogram bars? Let’s break it down!
What Are RSI Histogram Bars?
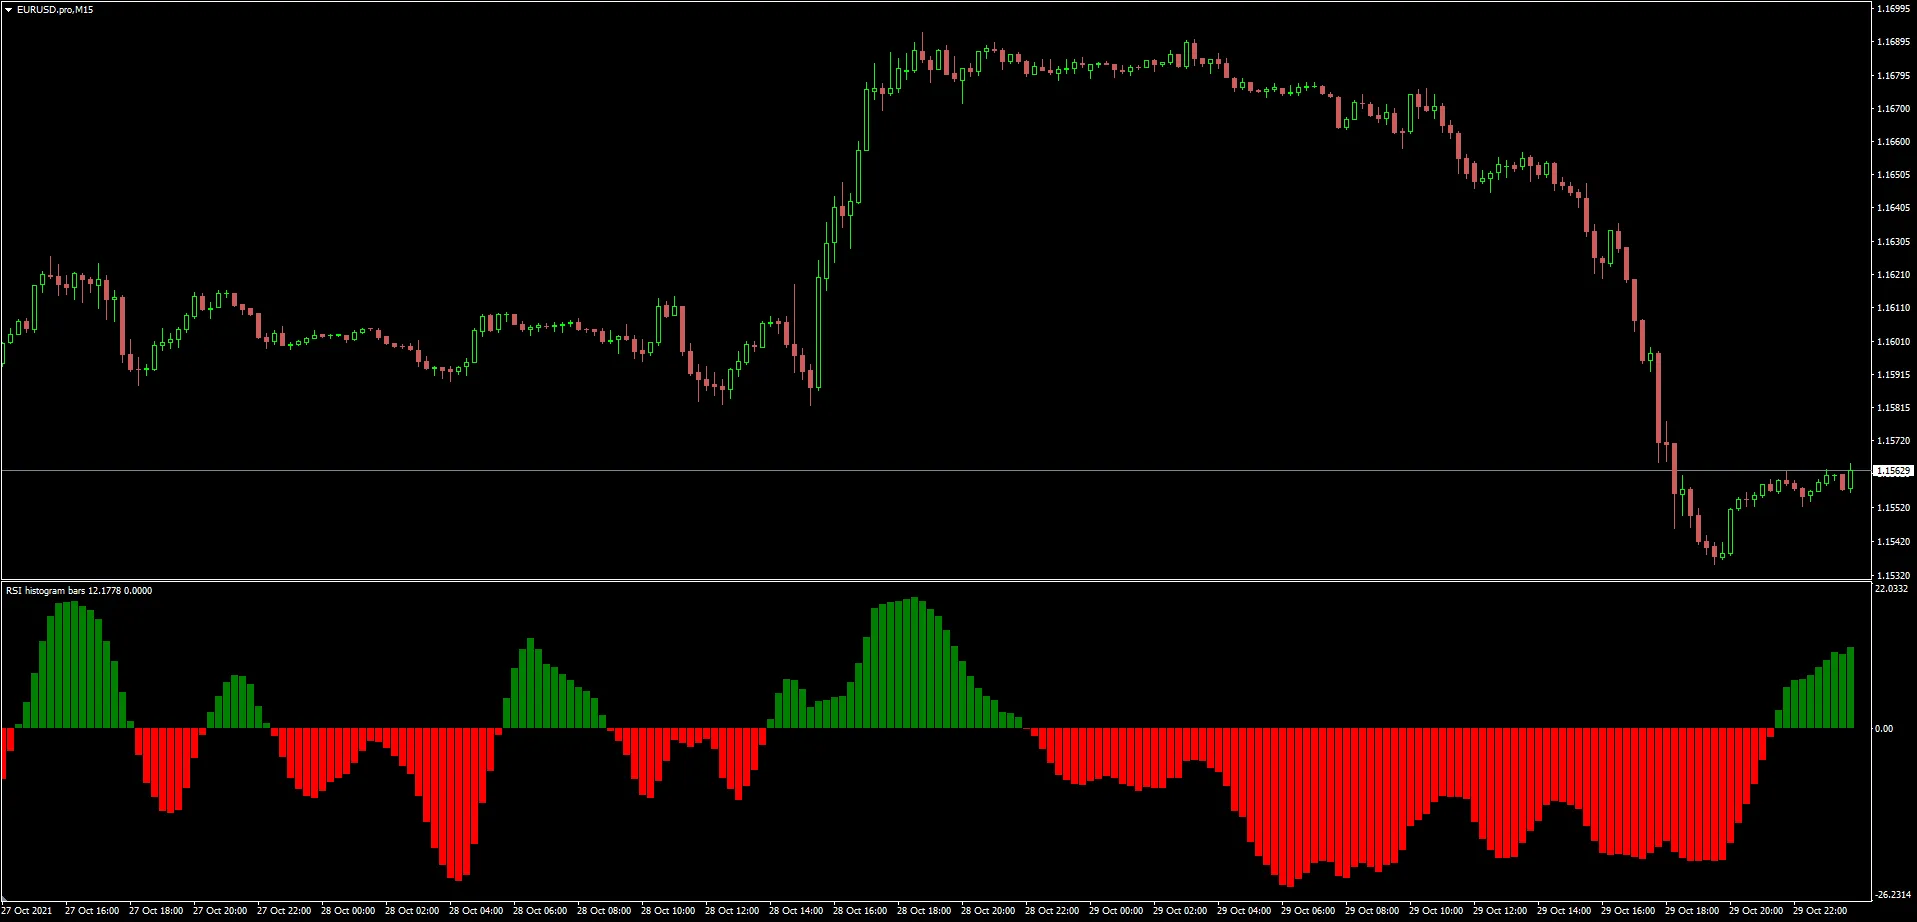
The RSI, or Relative Strength Index, is a popular momentum oscillator that measures the speed and change of price movements. The histogram bars represent the difference between the RSI and its signal line, giving you a clearer picture of market momentum.
Why Use RSI Histogram Bars?
- Visual Clarity: The histogram makes it easier to spot trends and reversals at a glance.
- Trade Signals: Look for divergence between the histogram and price to identify potential entry and exit points.
- Market Sentiment: Rising histogram bars indicate bullish momentum, while falling bars suggest bearish pressure.
How to Incorporate Them in Your Trading Strategy
When using RSI histogram bars, consider combining them with other indicators for a more robust analysis. For instance, pairing them with moving averages can help confirm trends and enhance your decision-making process.
In conclusion, RSI histogram bars are a valuable addition to your trading toolkit. By understanding and utilizing them effectively, you can gain a better grasp of market dynamics and improve your trading outcomes. Happy trading!


Comments 0