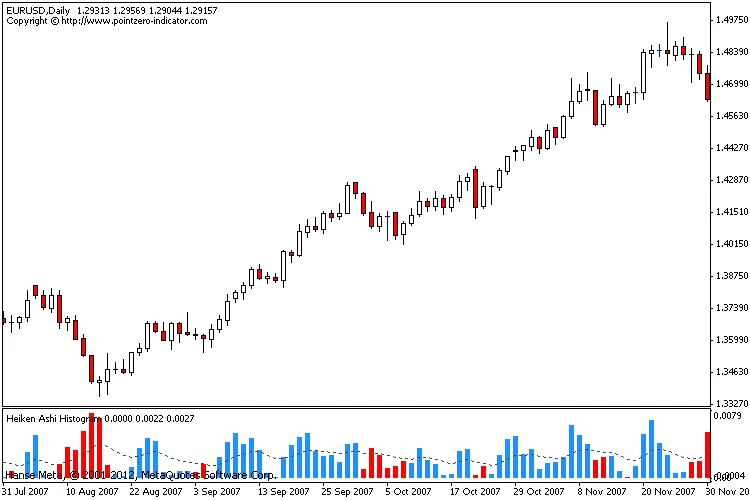
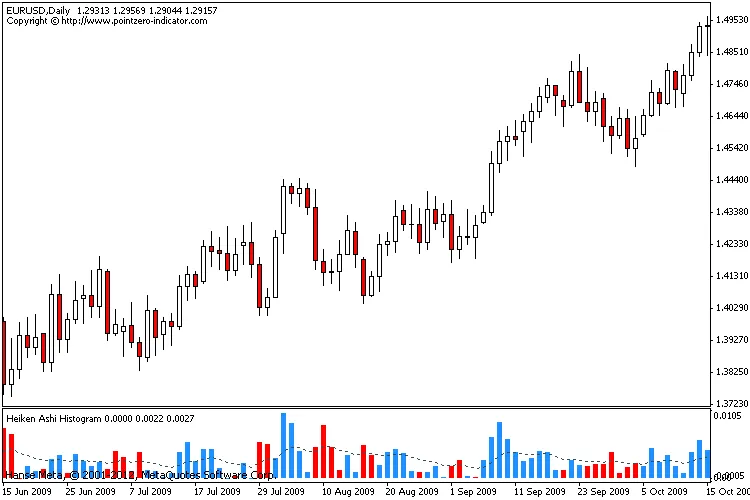
If you’re looking to enhance your trading game, the Heiken Ashi Histogram could be just the tool you need. This nifty indicator shows the color changes of Heiken Ashi candles along with a histogram that reflects the rate of change, all while utilizing a moving average to indicate average shifts in price. When you see those Heiken Ashi bars suddenly switch colors, and the new bar pops up above the moving average, it’s a solid sign that the price movement could continue in that direction for a bit.
But that's not all! The moving average in this setup can also help you identify range-bound markets, making it a great addition to both trend-following and short-term trading strategies.
This indicator is a slight variation of the Heiken Ashi Oscillator and relies on the original Heiken Ashi Indicator, which you'll find attached here.
Recommendations:
- Integrate it with your existing trading strategy for optimal results.


Comments 0