MA Candles Two Colors 2.0: Now also available for MetaTrader 5
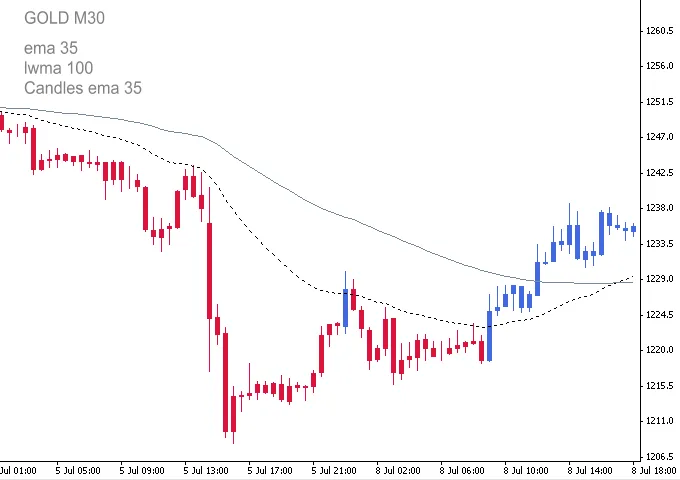
The MA Candles Two Colors indicator is a powerful tool that highlights price trends by drawing candles in different colors above and below a Moving Average (MA) line.
Supported MA Methods:
- Simple
- Exponential
- Smoothed
- Weighted
- Triangular*
This indicator comes packed with standard parameters for the MA, including Period, Shift, Method, and Price.
* The Triangular MA is included — check the download files attached.
Ensure that all Input Variables and Value parameters (MA Period, Shift, Method, and Price) on the current Indicator and the Moving Average provided by the user match perfectly.
What's new? The indicator now automatically switches the chart to a Line Chart and sets the Line Chart color to None before drawing the MA Candles. So, you can skip Steps 1-7!
- Open a new chart.
- Change the chart price graphic to Line Chart by pressing (Alt + 3) or navigating to 'Charts' in the top menu and selecting 'Line Chart'. Make sure 'Bar Chart' or 'Candlesticks' isn't selected.
- Open the Chart Properties window by pressing (F8) or right-clicking anywhere on the chart and selecting 'Properties'.
- Select the Colors tab.
- For 'Line Chart:', click the dropdown and change the color to 'None'. Your chart should now be a blank canvas.
- Consider saving a template of this blank chart for future use with other currency pairs or instruments.
- Attach the Indicator Color Candles crossing the MA to your blank chart.
The default settings for MA1 are: Period = 1, Shift = 0, Method = 0 (SMA), Price = 0 (Close). This means the color candles will change based on the price closing above or below MA2.
The default method for MA2 is EMA.
Note: The MAs need to be provided by the user and are not part of the Indicator.
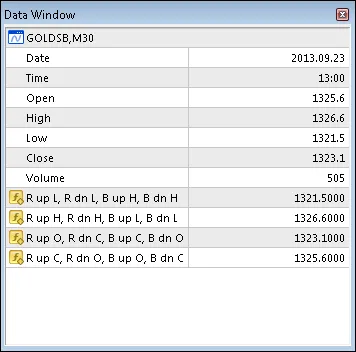
Candle Accuracy: Although the standard chart price graphic is hidden, it remains active. You can view Open, High, Low, and Close prices in the MetaTrader 4 Data Window (press Ctrl+D or go to View → Data Window). You can verify the accuracy of the Indicator's Open, High, Low, and Close against the values in the Data Window. Just make sure your cursor is on the relevant colored candle:
Understanding the Data Windows:
- Hidden Candle Open: 1325.6
- Hidden Candle High: 1326.6
- Hidden Candle Low: 1321.5
- Hidden Candle Close: 1323.1
The indicator's candle H, L, O, and C are listed in Columns R up, R dn, Bu, and B dn (Red up candle, Red down, Blue up candle, Blue down candle).
- R dn L: 1321.5
- B dn H: 1326.6
- R dn C: 1323.1
- R dn O: 1325.6
All Input parameters and options are customizable and will save automatically. If you reset after changing Inputs or Color parameters, the Color Candles will display as Bars. To switch back, simply change to a different timeframe and then return.
Input and Parameters:
- Candle_MA_Period - 34;
- Candle_MA_Shift - 0;
- Candle_MA_Type - 1;
- Candle_MA_Price - 0;
- Candle_Shadow_Width - 1;
- Candle_Body_Width - 4;
- Type_Key - 0: SMA, 1: EMA, 2: SMMA, 3: LWMA;
- Price_Key - 0: Close, 1: Open; 2: High;
- Price_Key_cont - 3: Low, 4: Median;


Comments 0