View Indicator Screenshot Author of the Idea: Alex Spiroglou, Code Author: OU Let’s dive into th...
If you're diving into the world of trading, understanding patterns is crucial, and one of the most ...
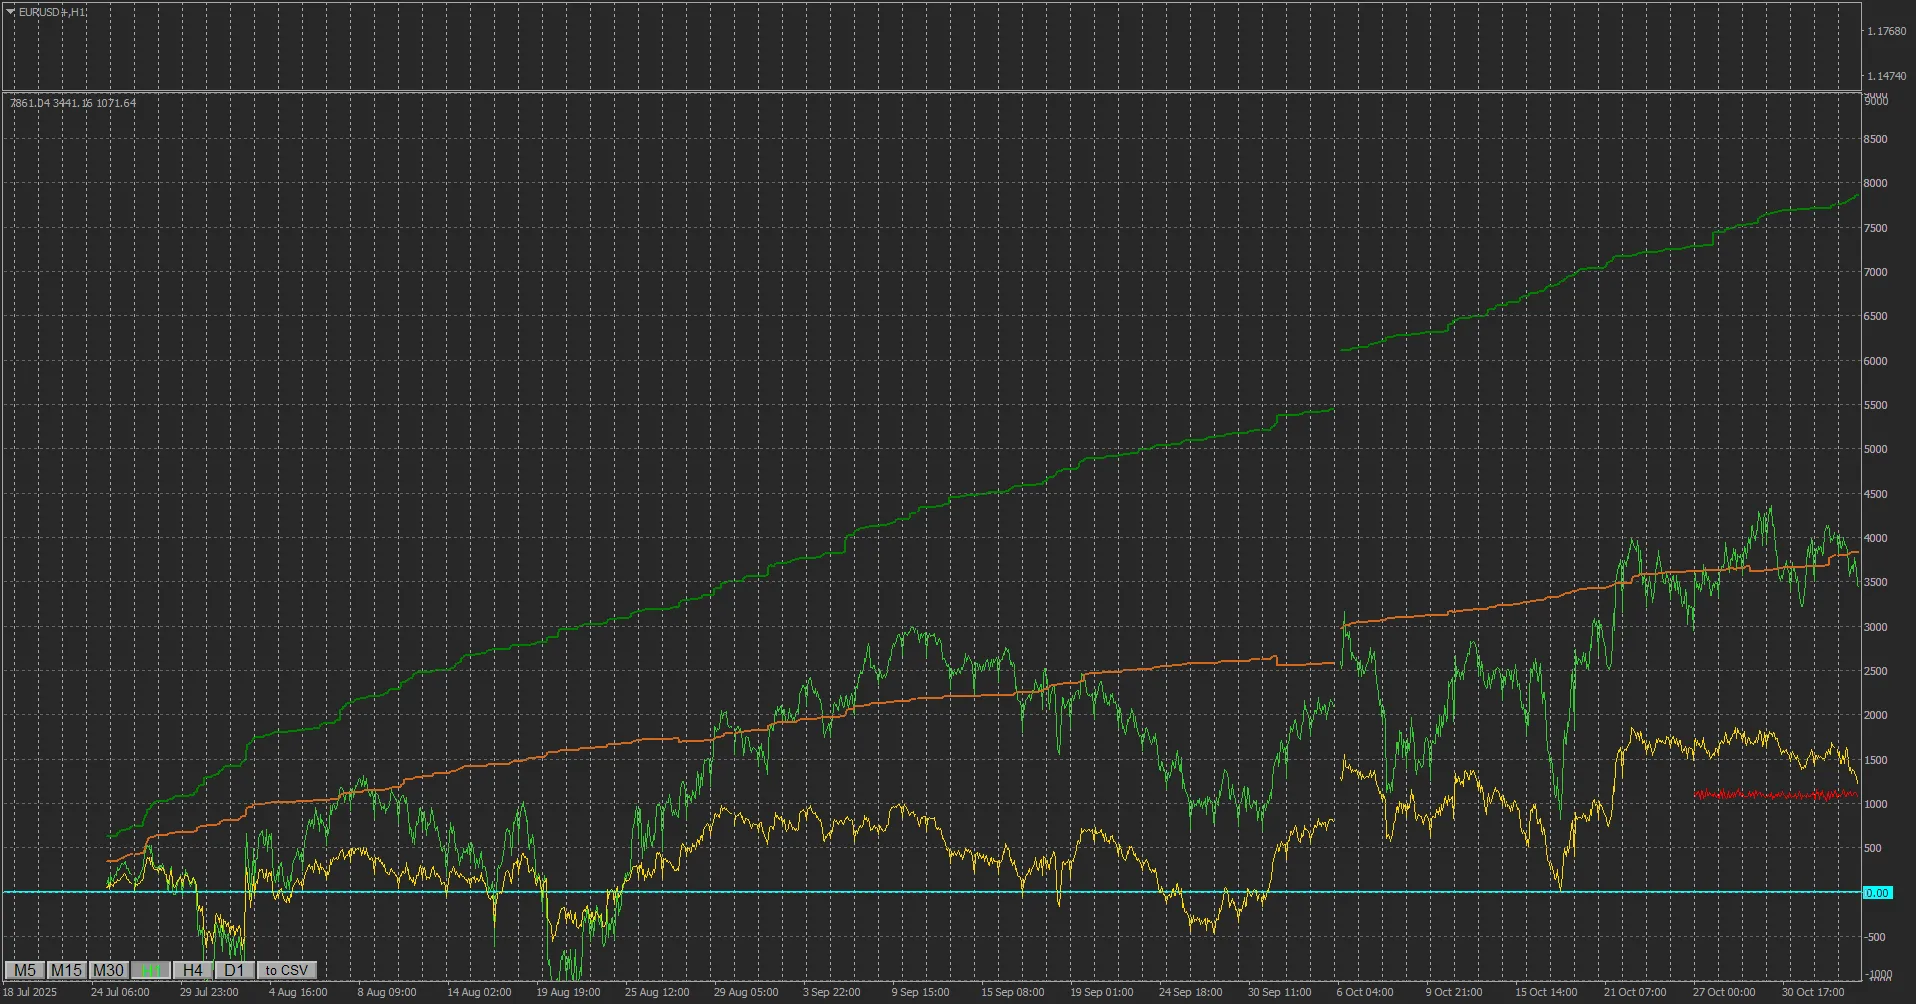
Unlock Trading Insights with the Data Collector Indicator If you’re looking to step up your trading...
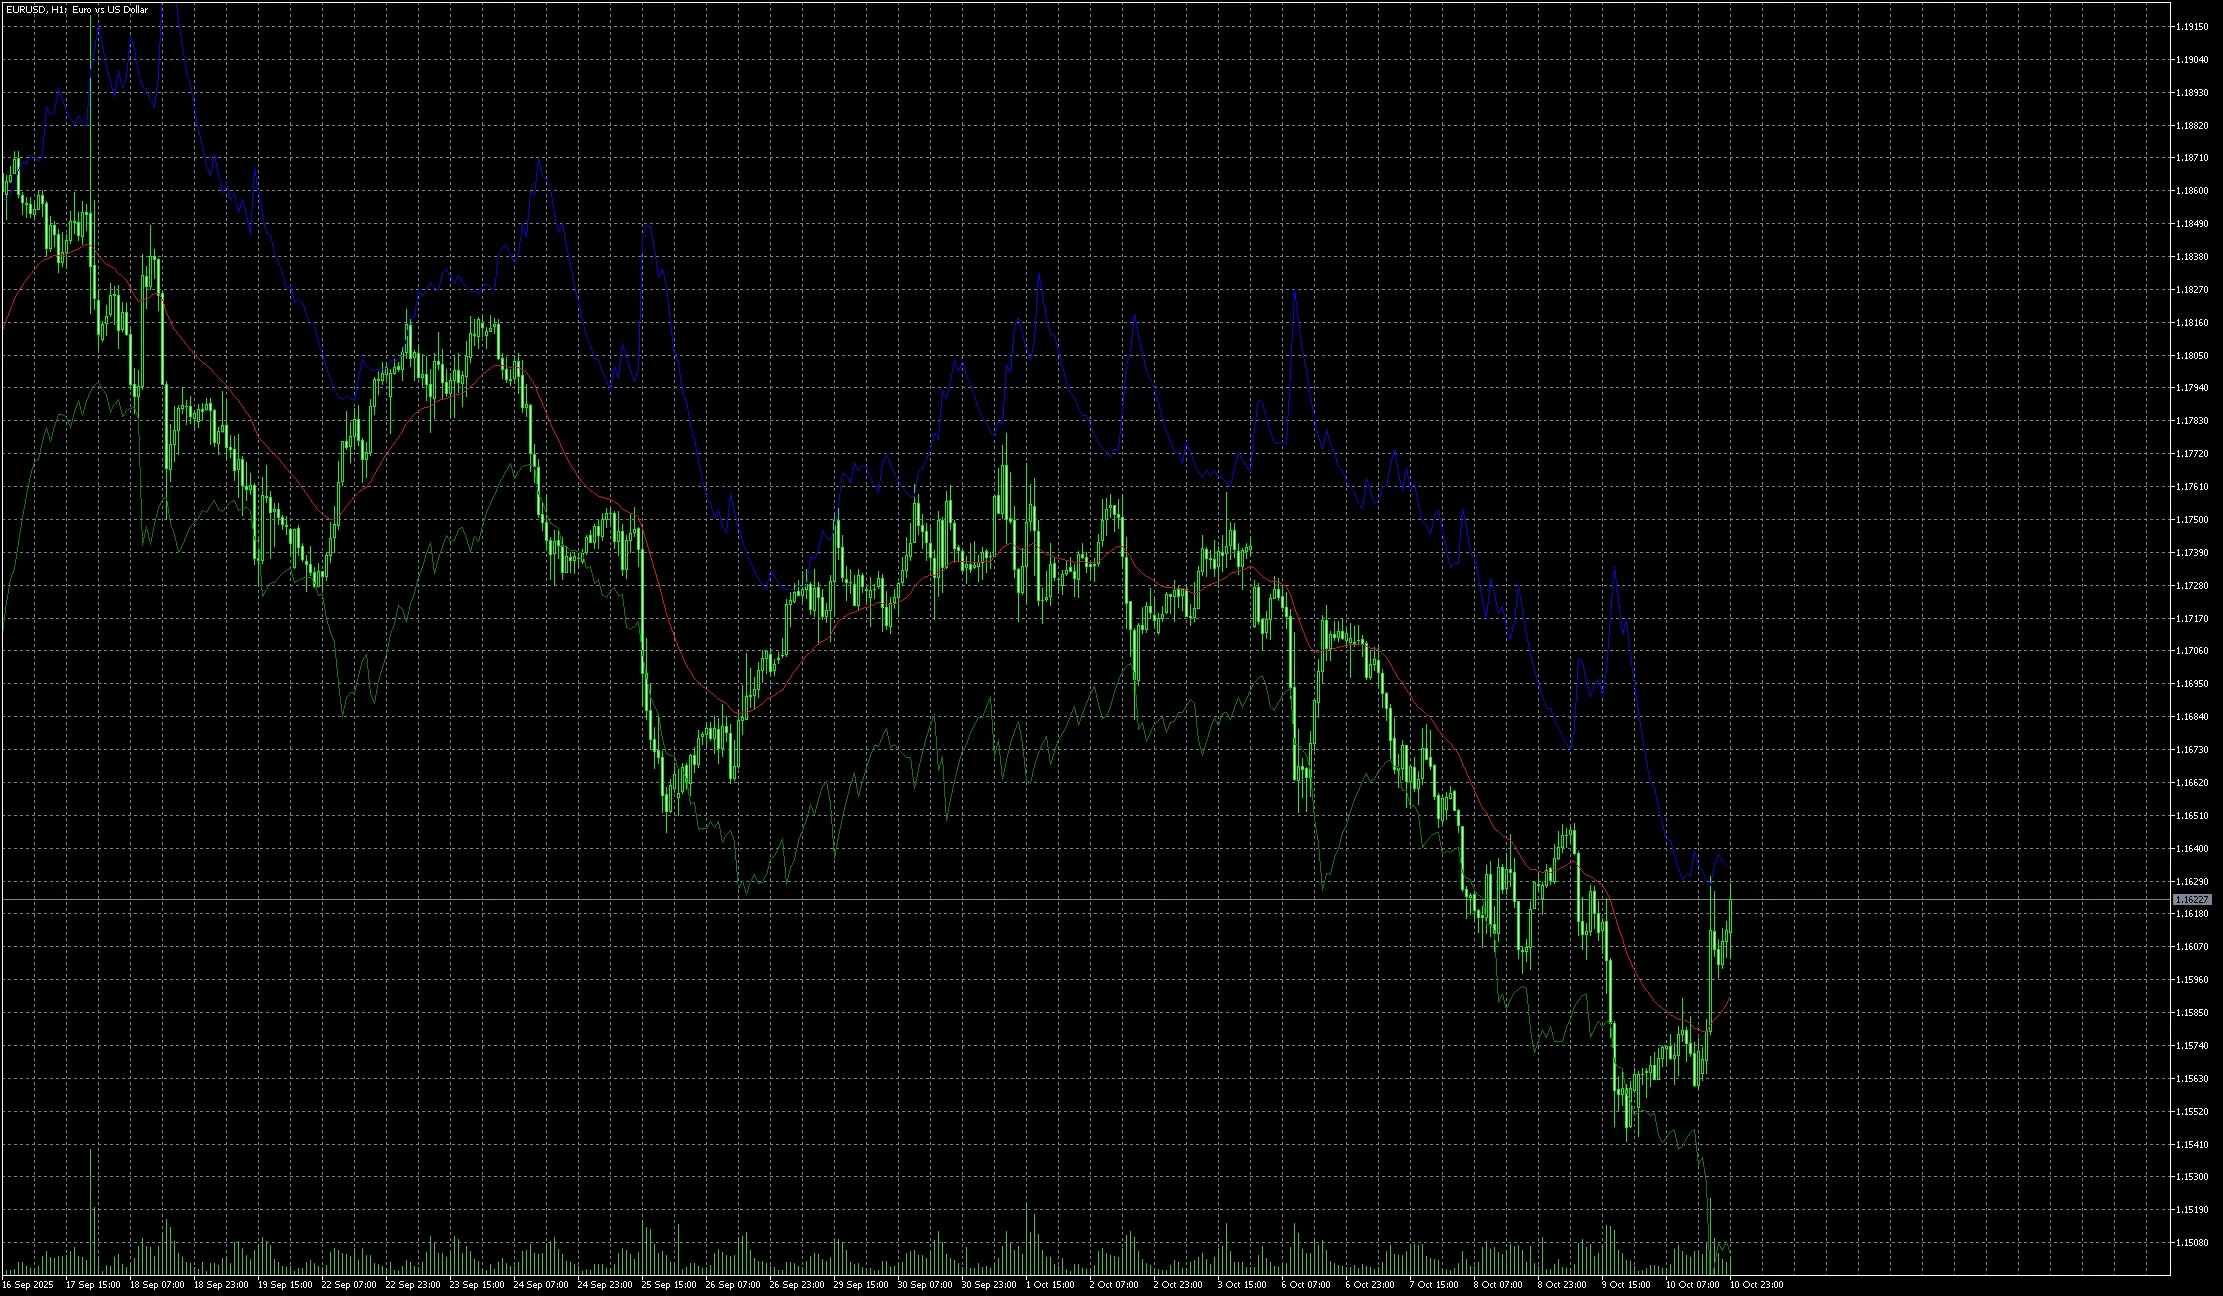
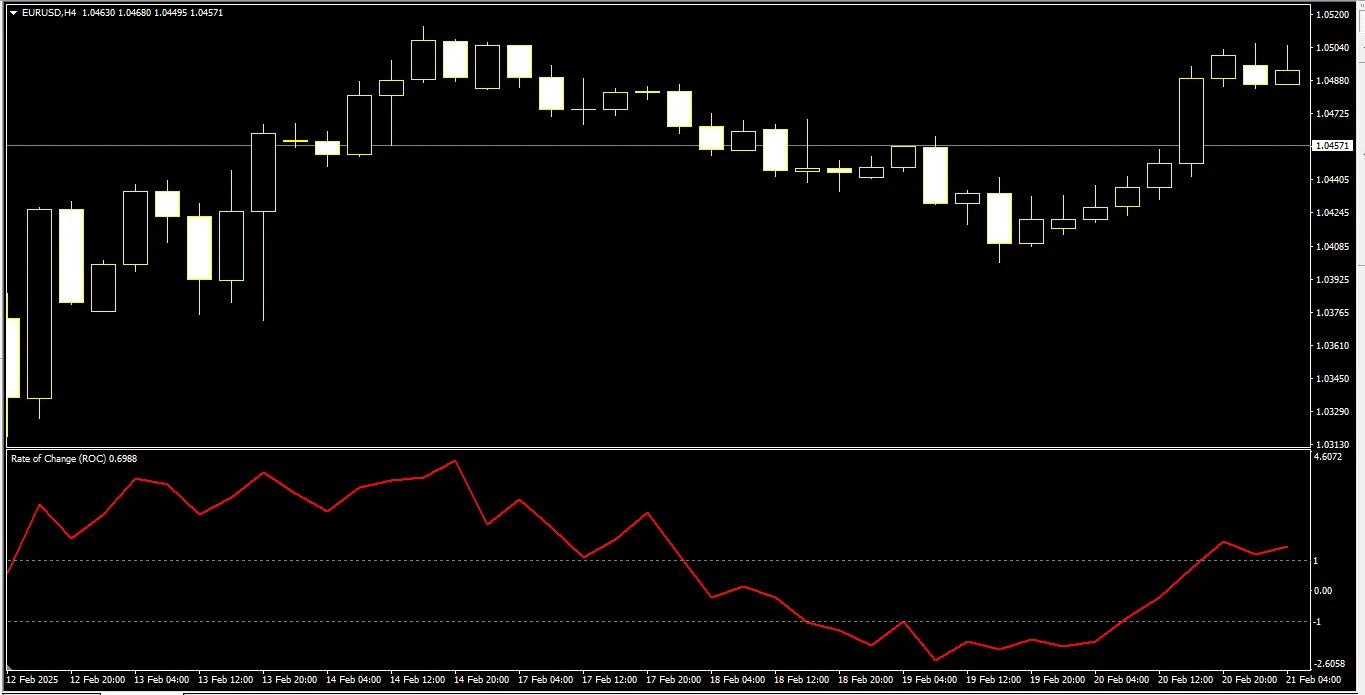
Unlocking the Power of Reverse Engineered RSI Have you ever wanted to see how the Relative Strength...
Are you looking to streamline your trading strategy? The TakeStop indicator for MetaTrader 4 is here...
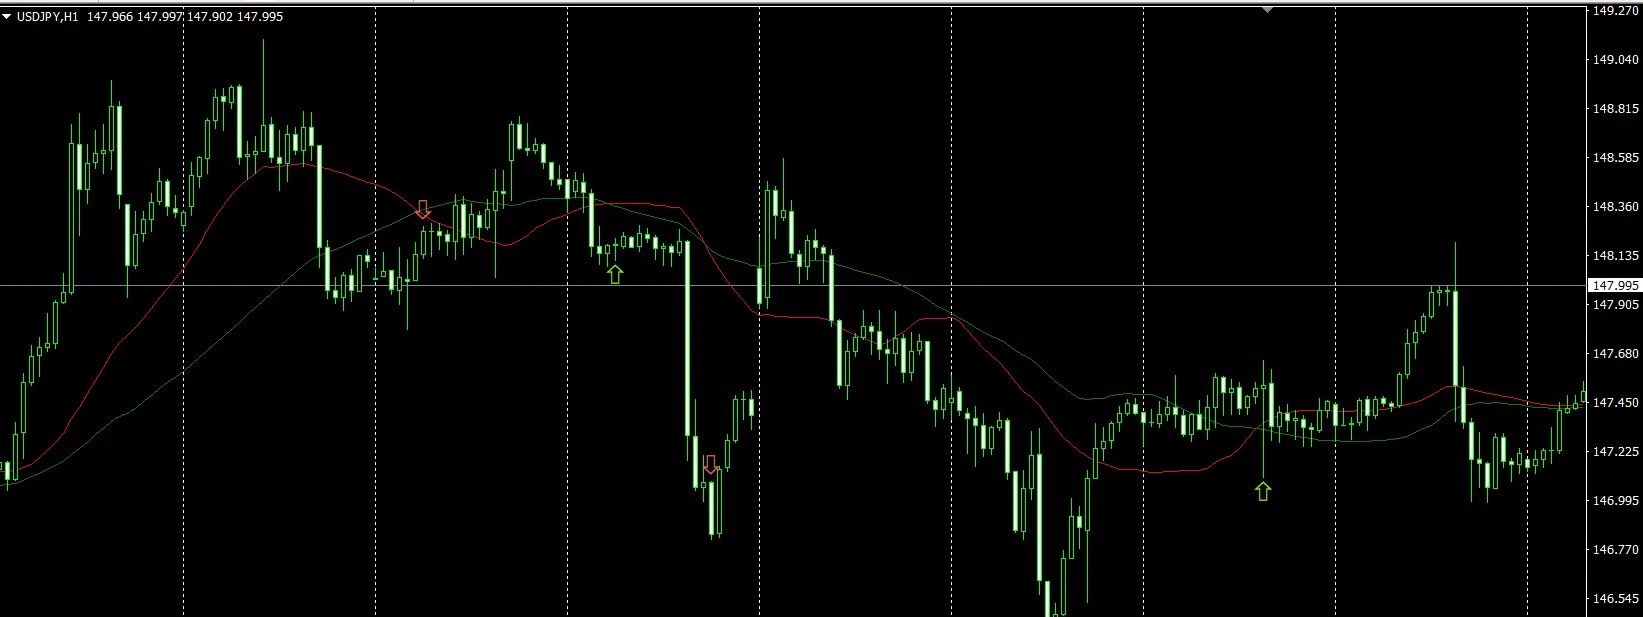
Let’s face it, the default moving average indicator in MetaTrader can leave you hanging when it come...
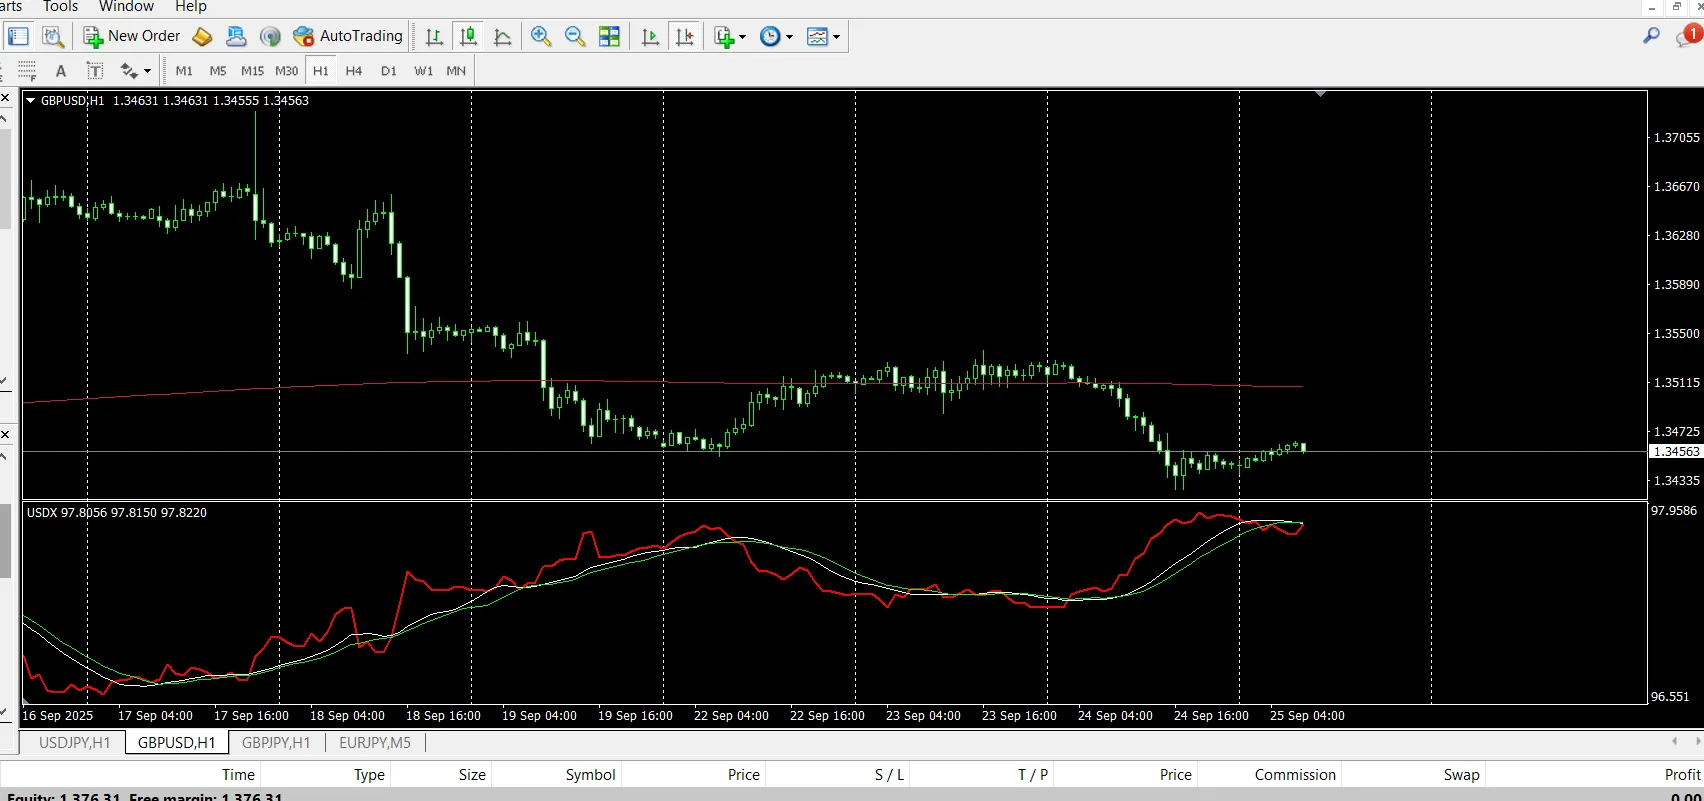
The Dollar Index Tracker is an essential tool that calculates and displays the US Dollar Index (USDX...
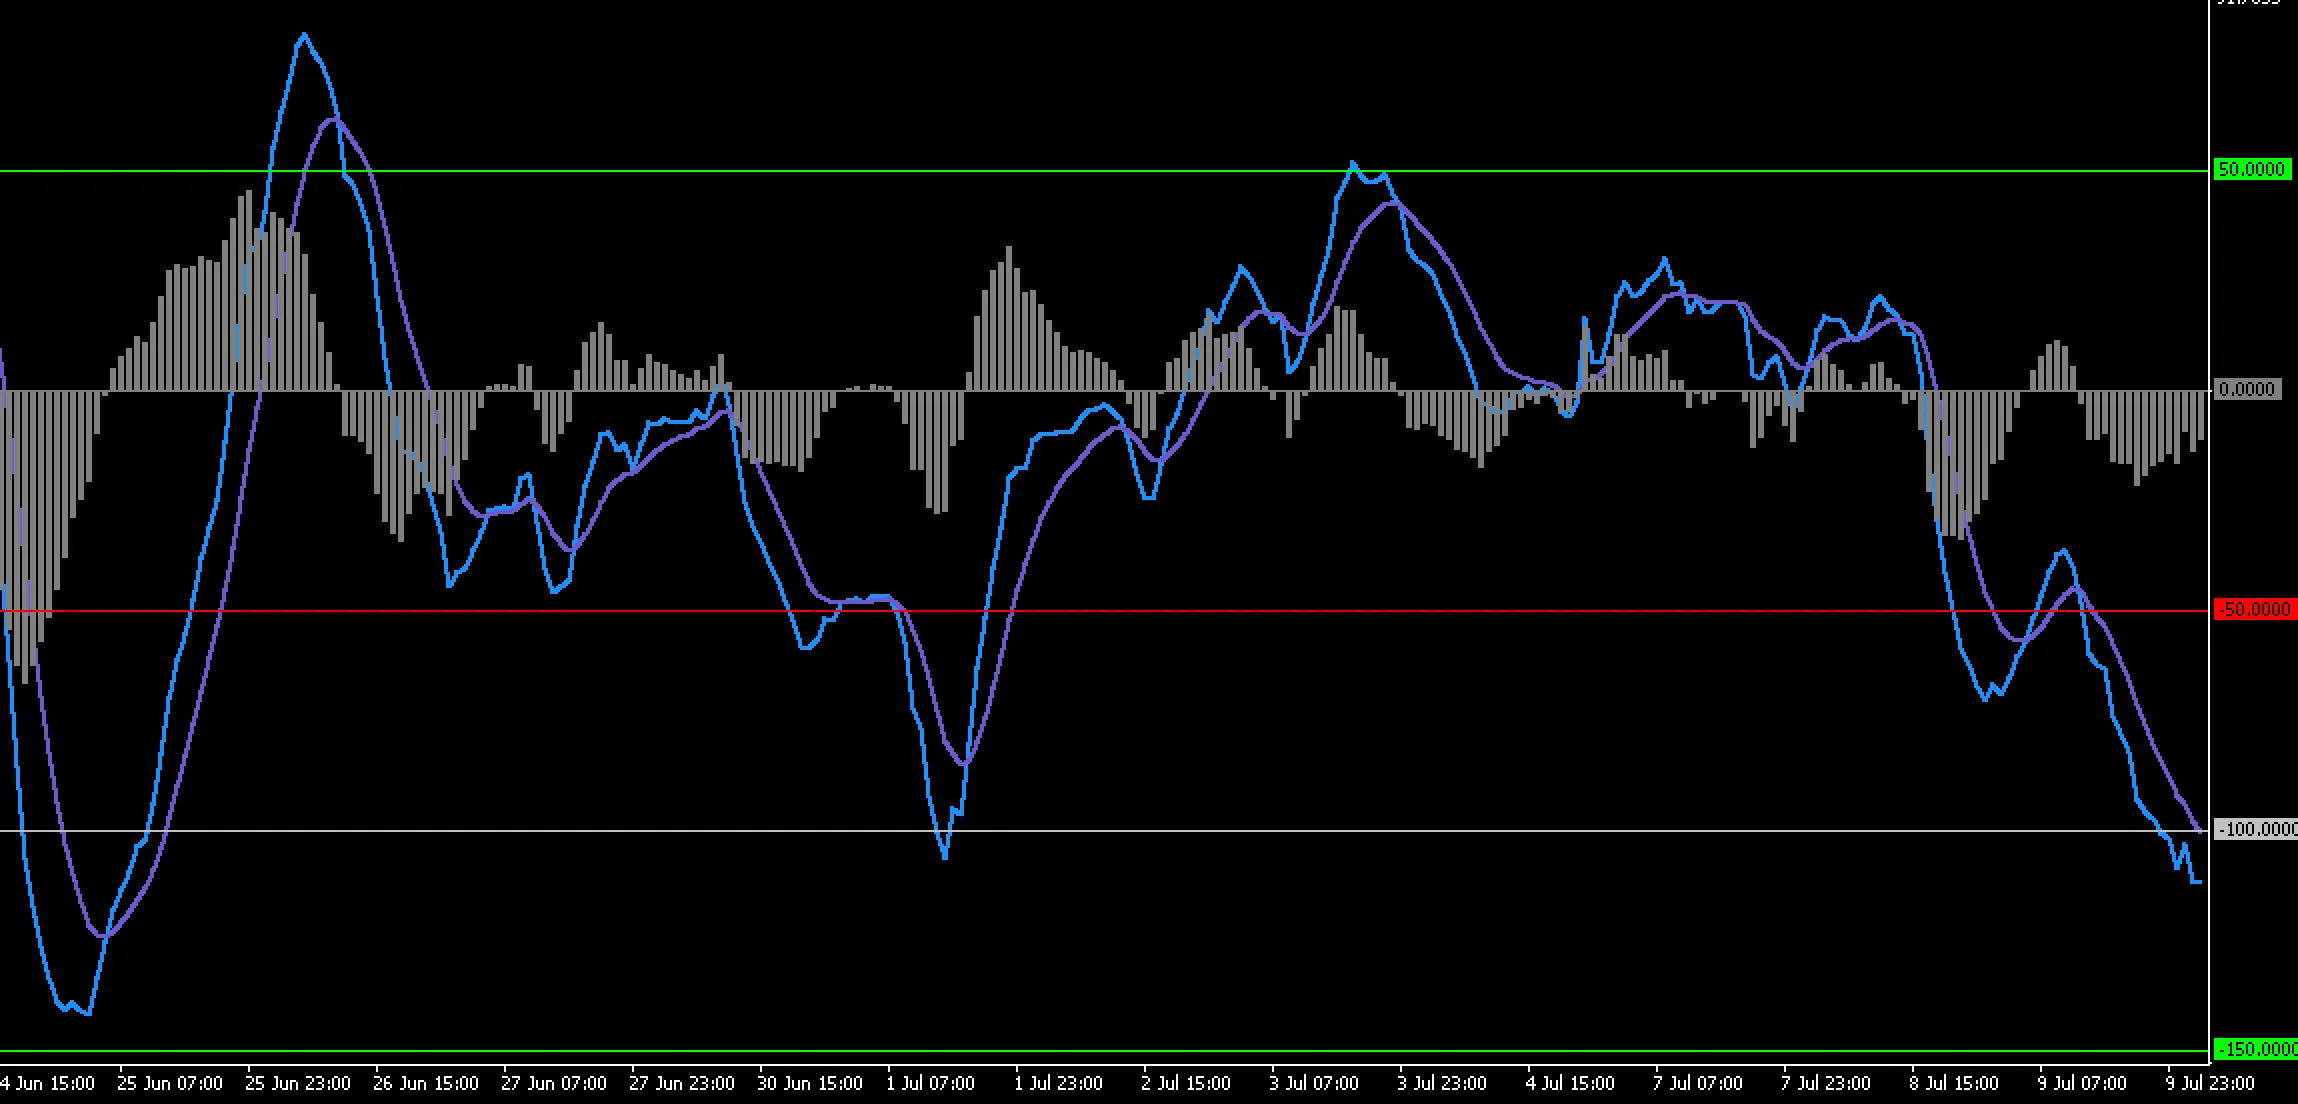
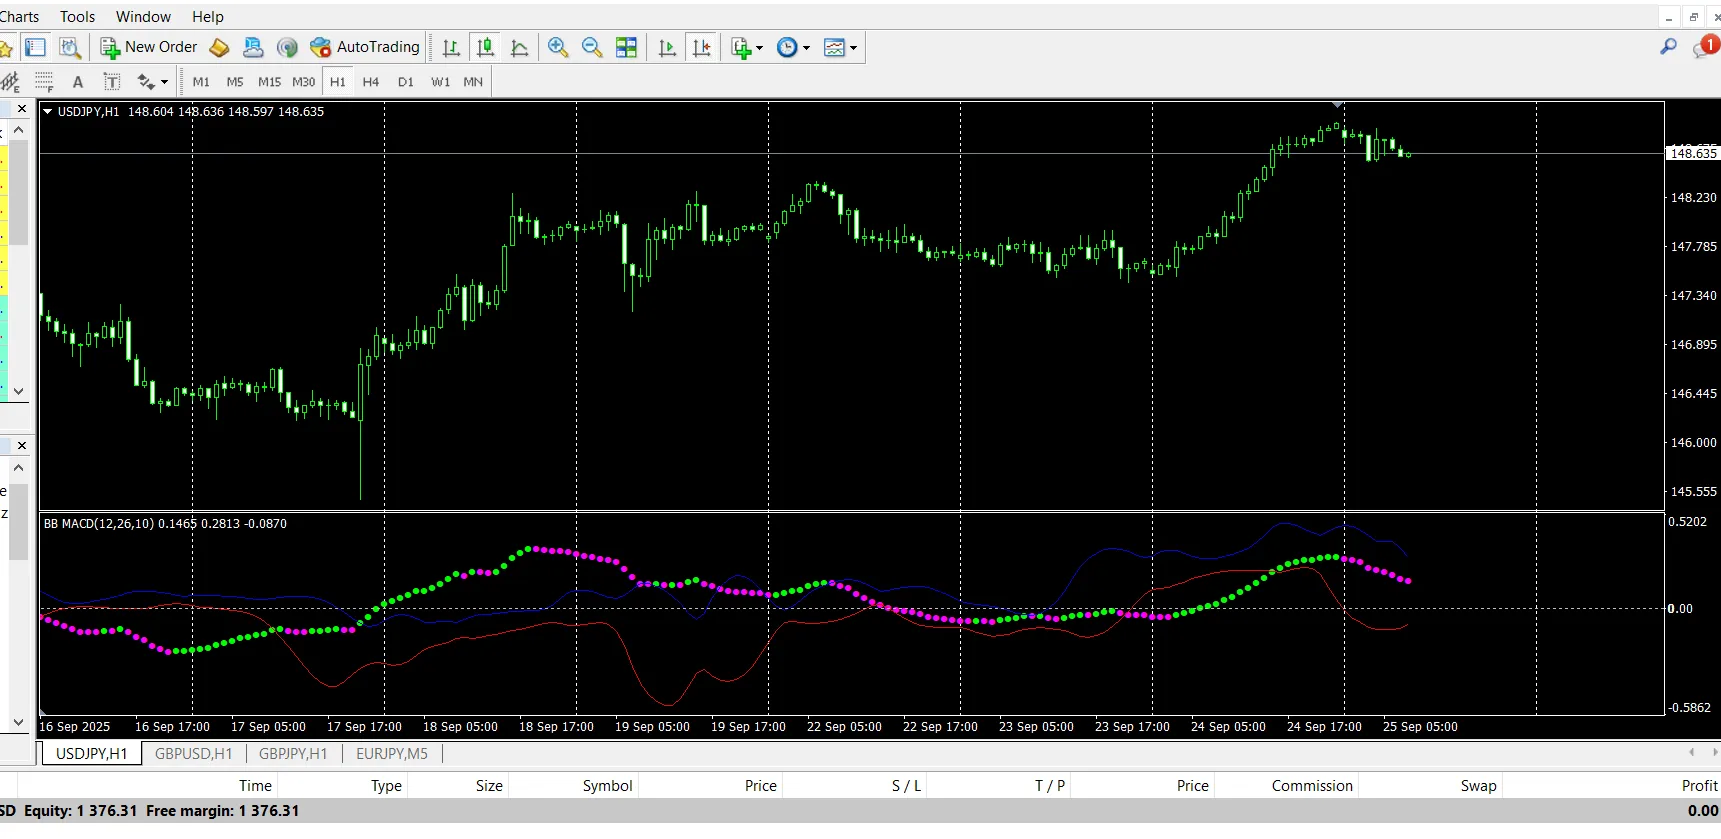
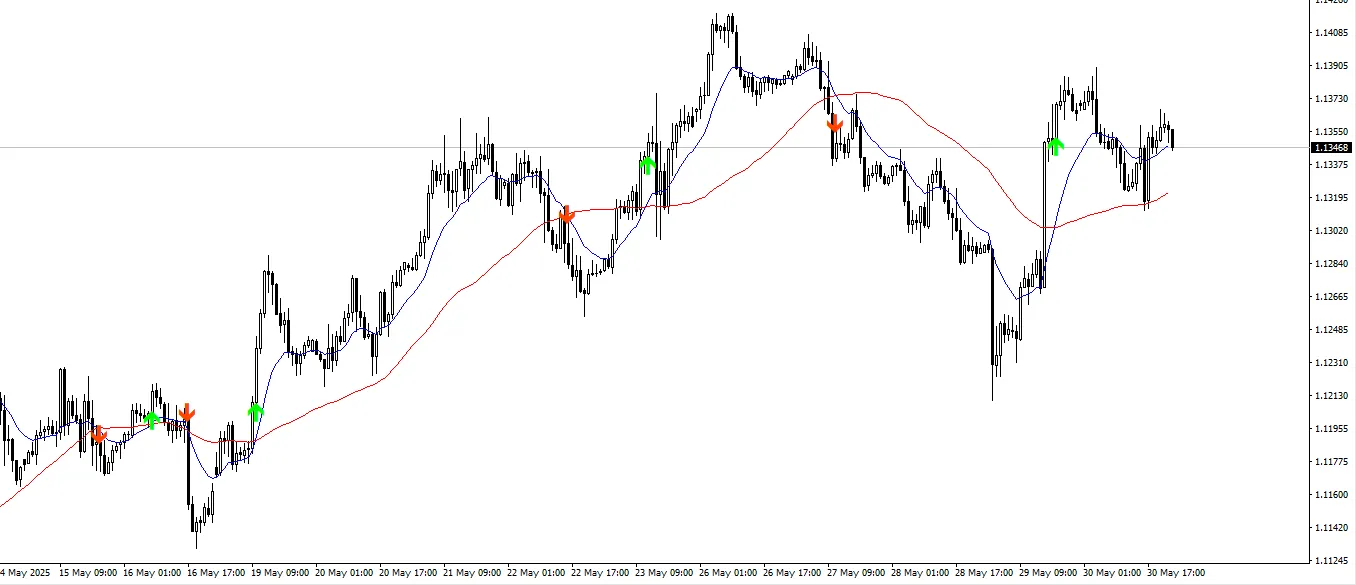
What Is Trend Vision? Trend Vision is a custom MT4 indicator that skillfully combines MACD momentum ...
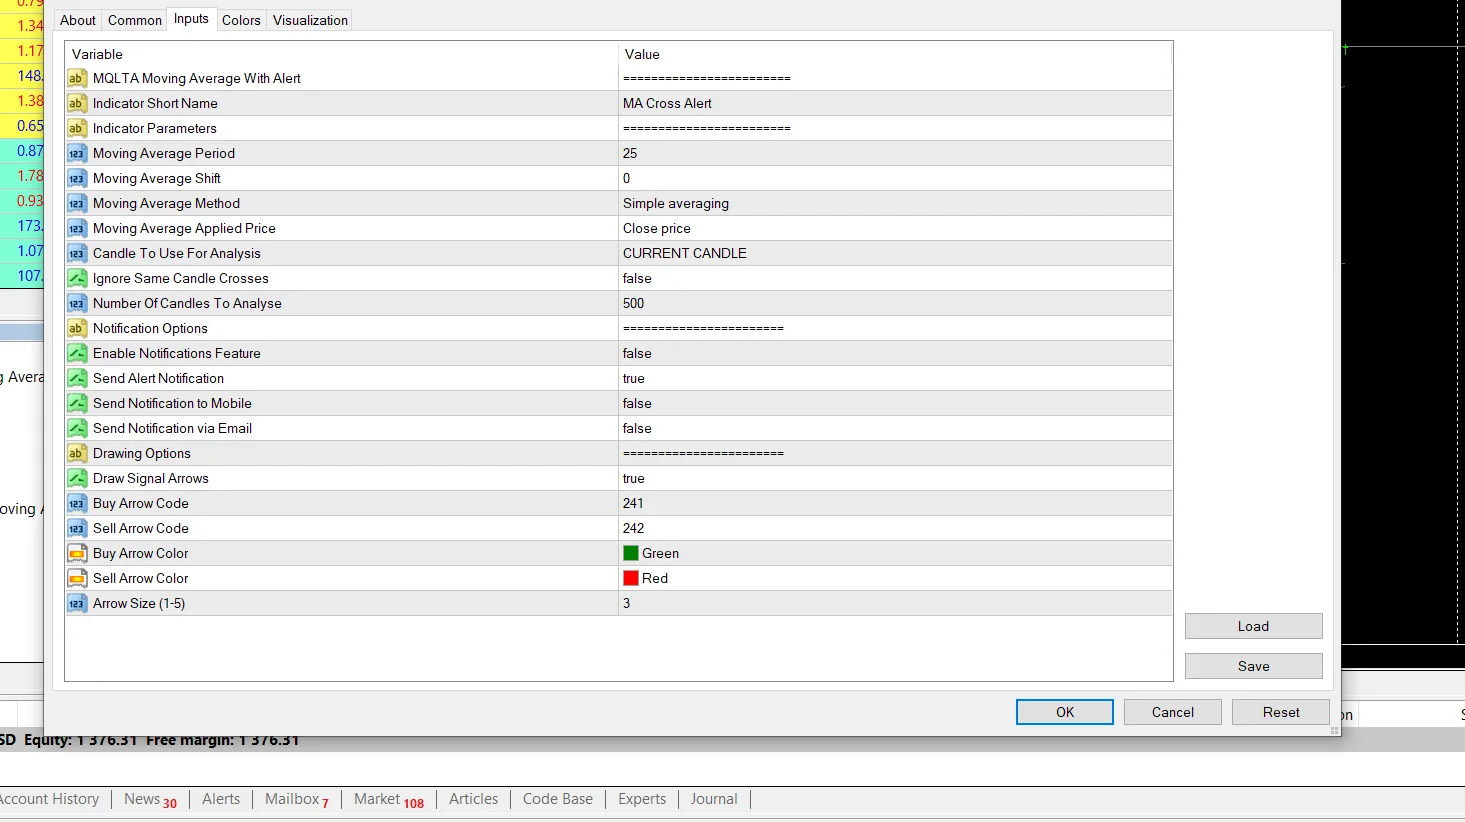
What Is MA Cross Alert? MA Cross Alert is a handy custom indicator for MetaTrader 4 that tackles a c...
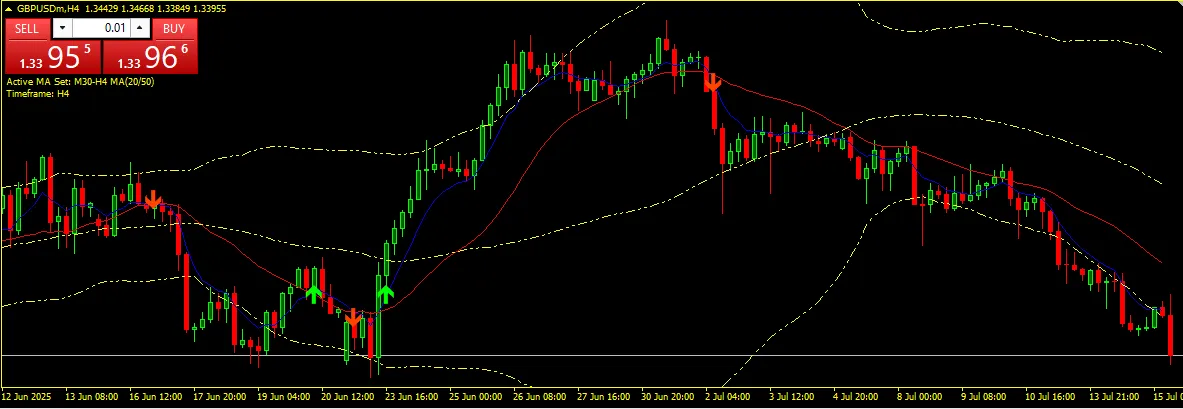
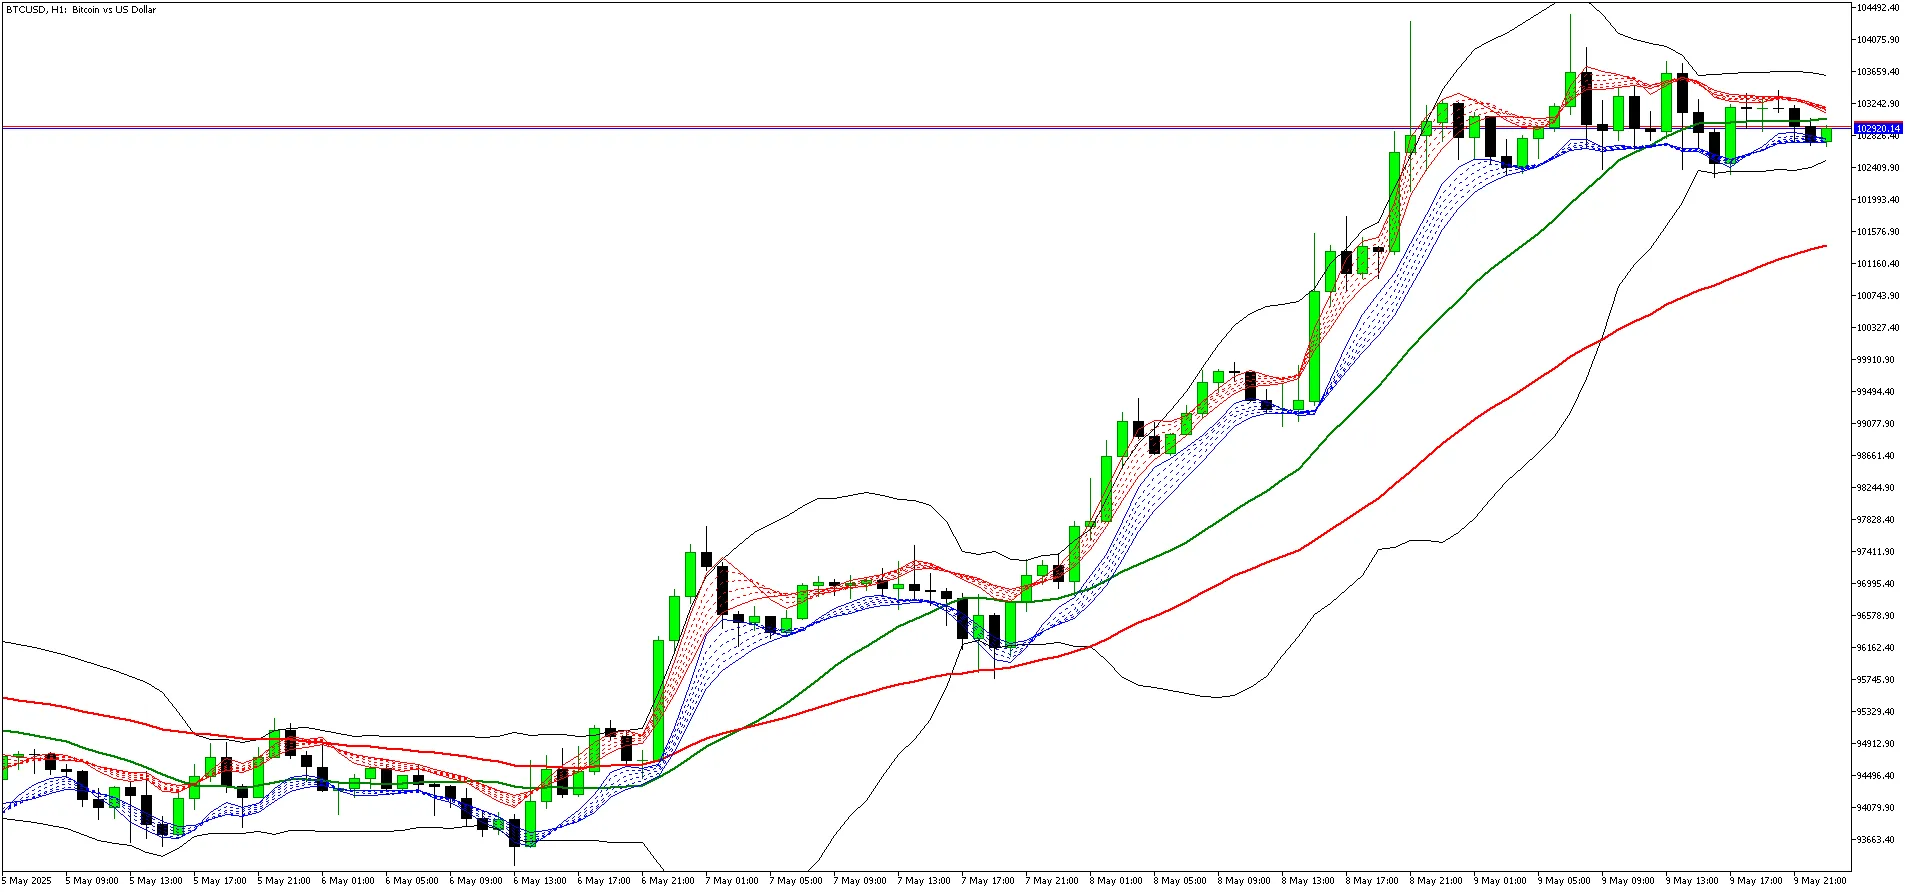
2 Moving Averages with Bollinger Bands is an incredibly versatile technical analysis tool for MetaT...
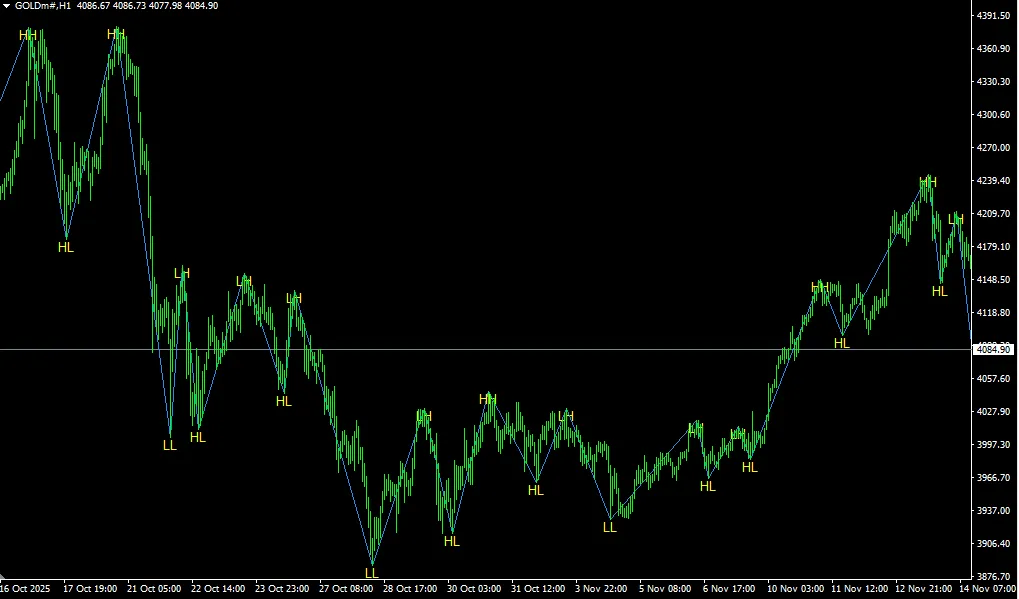
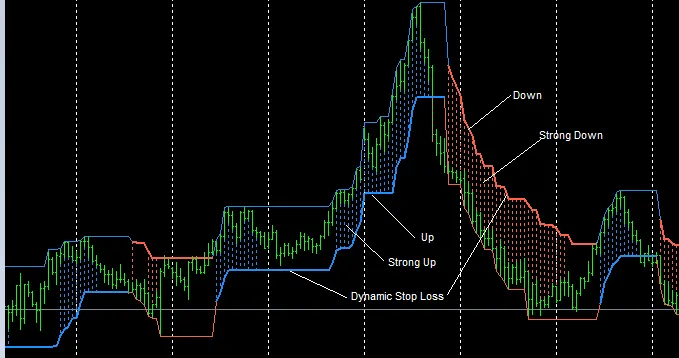
Understanding the HLPeak Trend Indicator The HLPeak Trend Indicator is a powerful tool for traders u...
Exciting news, traders! There’s a new update ready for you. You can download the Double MA with Spe...
Exciting news! We've just rolled out a new update. You can download the Double MA with Special Tim...
The BBMA, short for Bollinger Bands Moving Average, is a trading strategy that was pioneered by the ...
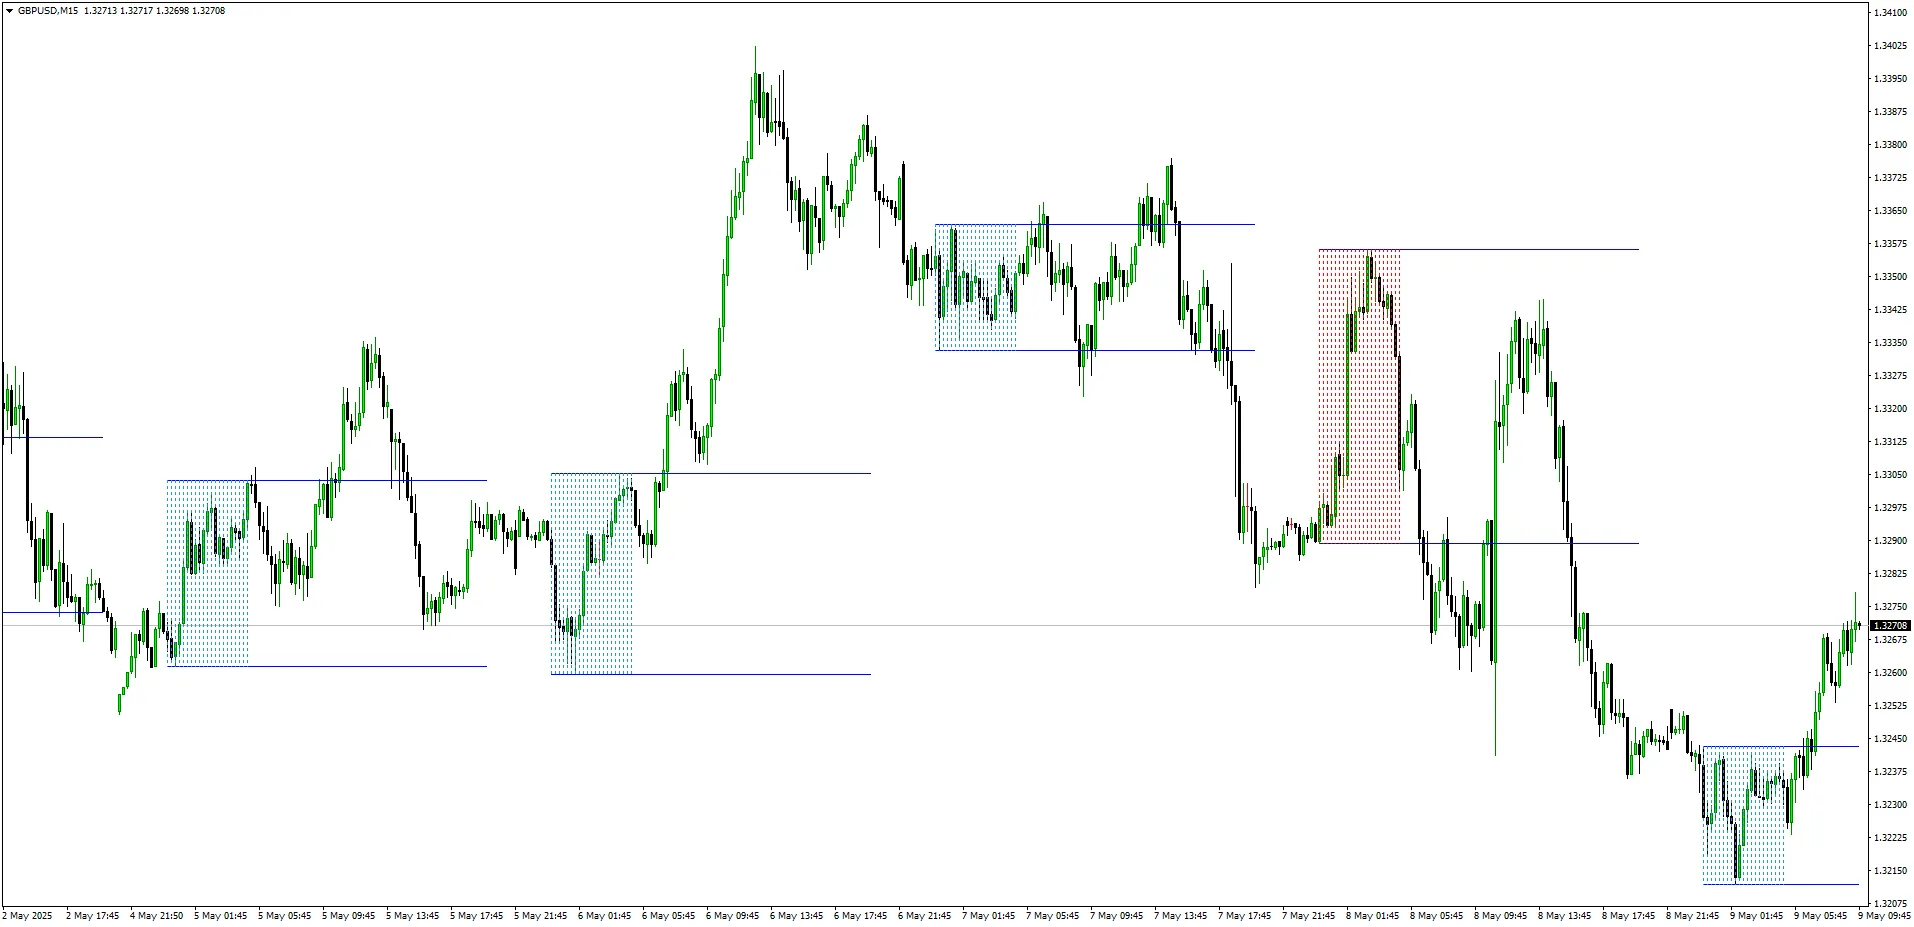
Hey fellow traders! Today, we're diving into the Range Breakout Indicator for MetaTrader 4. This han...
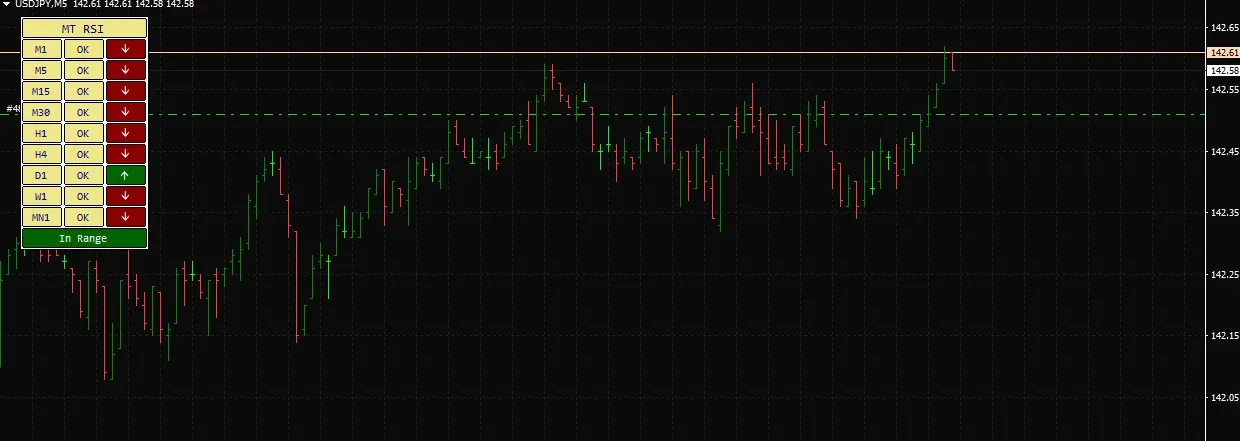
If you're looking to gain an edge in your trading, the RSI Timeframe Analyzer is a must-have tool fo...
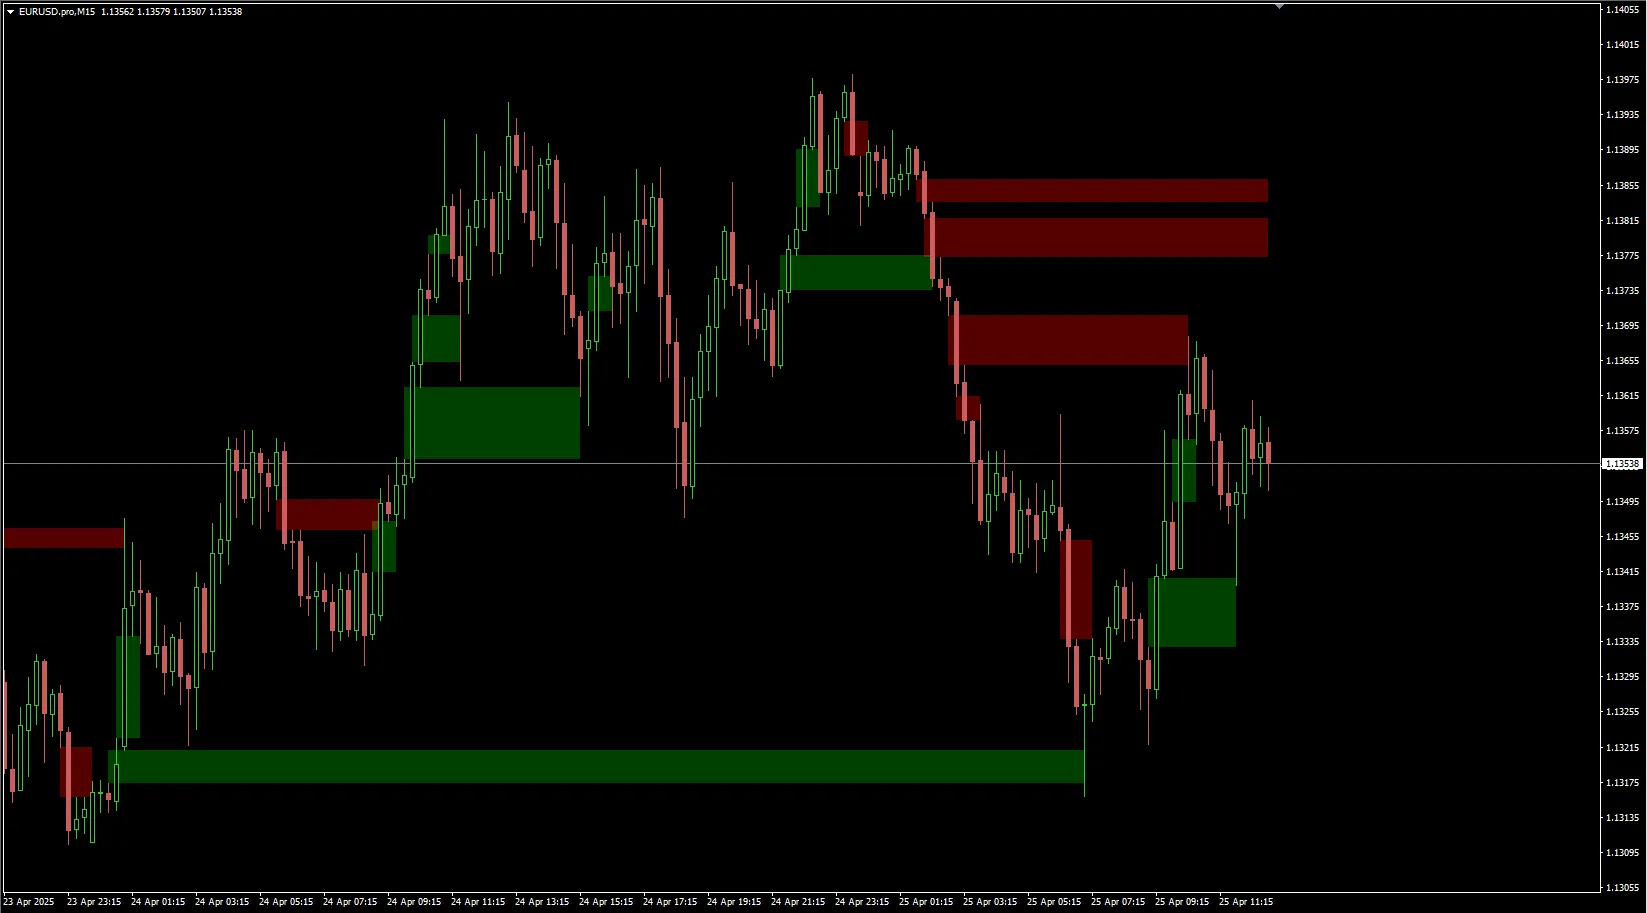
What Are Fair Value Gaps? Hey there, fellow traders! Today, we’re diving into a crucial concept tha...
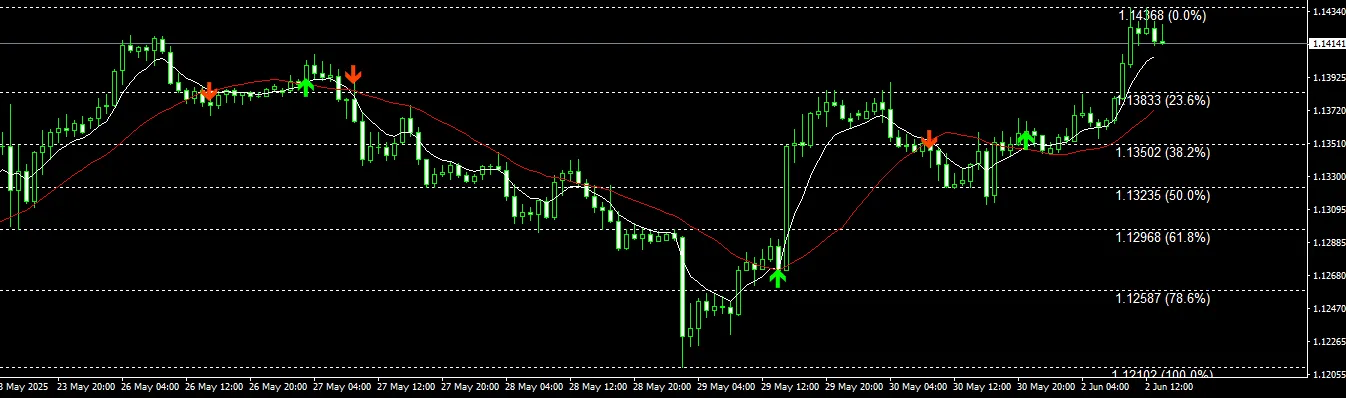
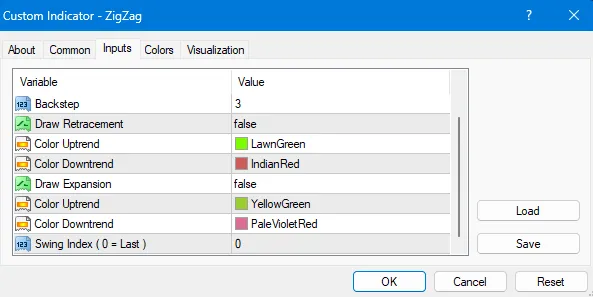
Description: If you’re looking to step up your trading game, the ZigZag Fibo indicator for MetaTrad...
Hey fellow traders! Today, we're diving into a handy tool that can help you keep your finger on the ...
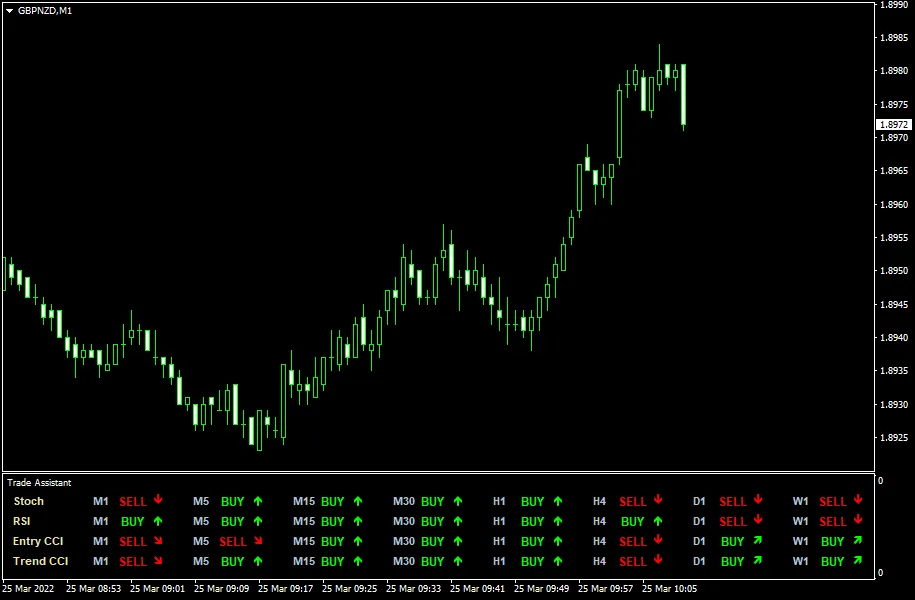
Trade Assistant MT4 Indicator is a powerful multi-timeframe tool designed to enhance your trading ex...