When it comes to candlestick patterns, two heavy hitters you definitely want to know about are Insi...
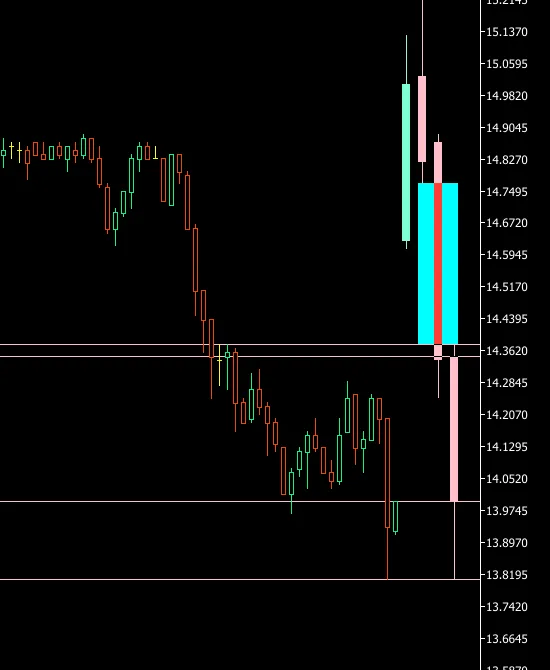
Fair Value Gaps (FVG) are crucial price zones where buying and selling pressure is out of balance, r...
Hey there, fellow traders! Today, let's dive into a powerful indicator that can elevate your trading...
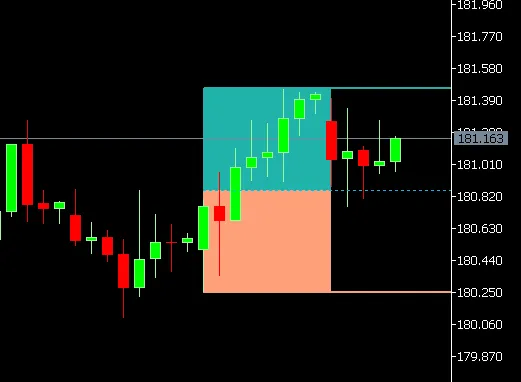
Ever wished you could easily spot premium and discount zones on your trading charts? Well, you're in...
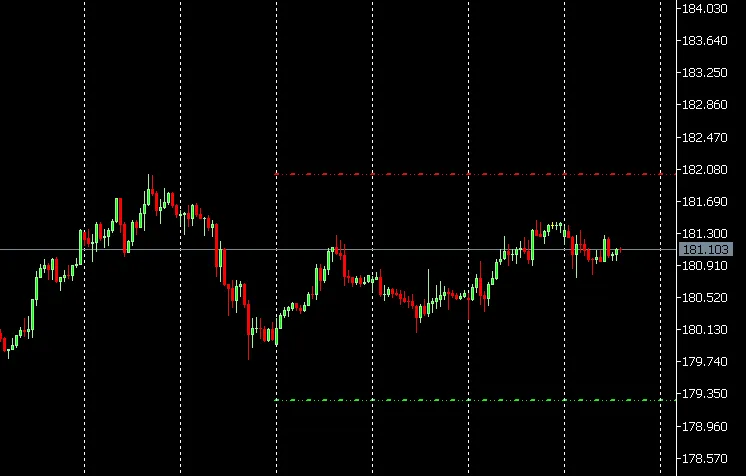
If you're looking to enhance your trading game, understanding the Previous Week High and Low can be ...
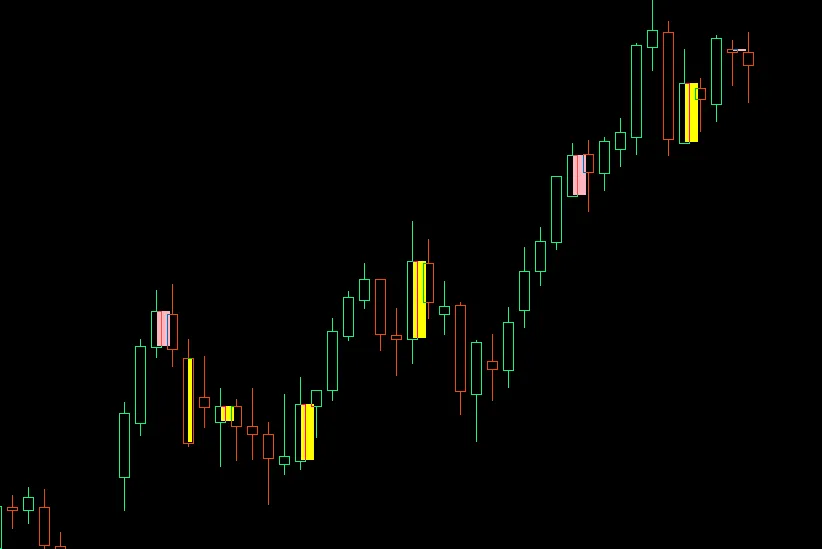
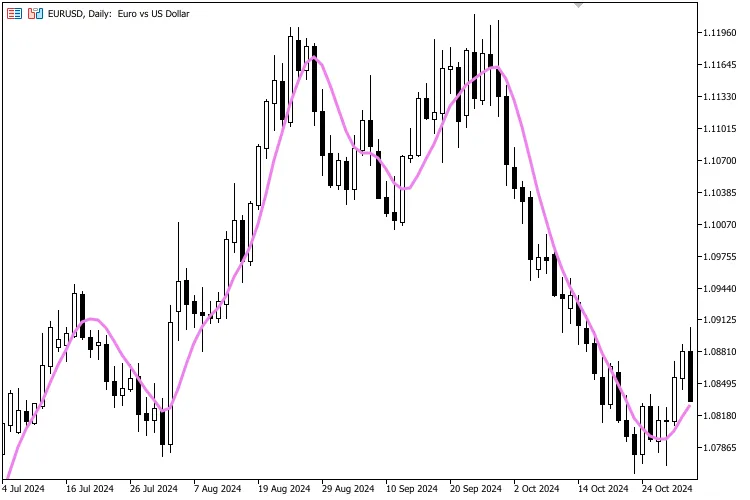
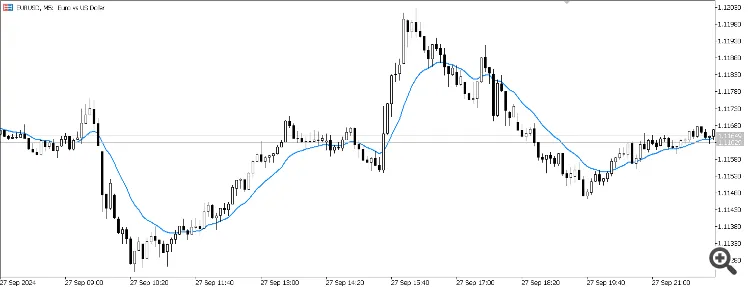
What Makes the Tillson T3 Special? If you’re looking for an edge in your trading strategy, let me...
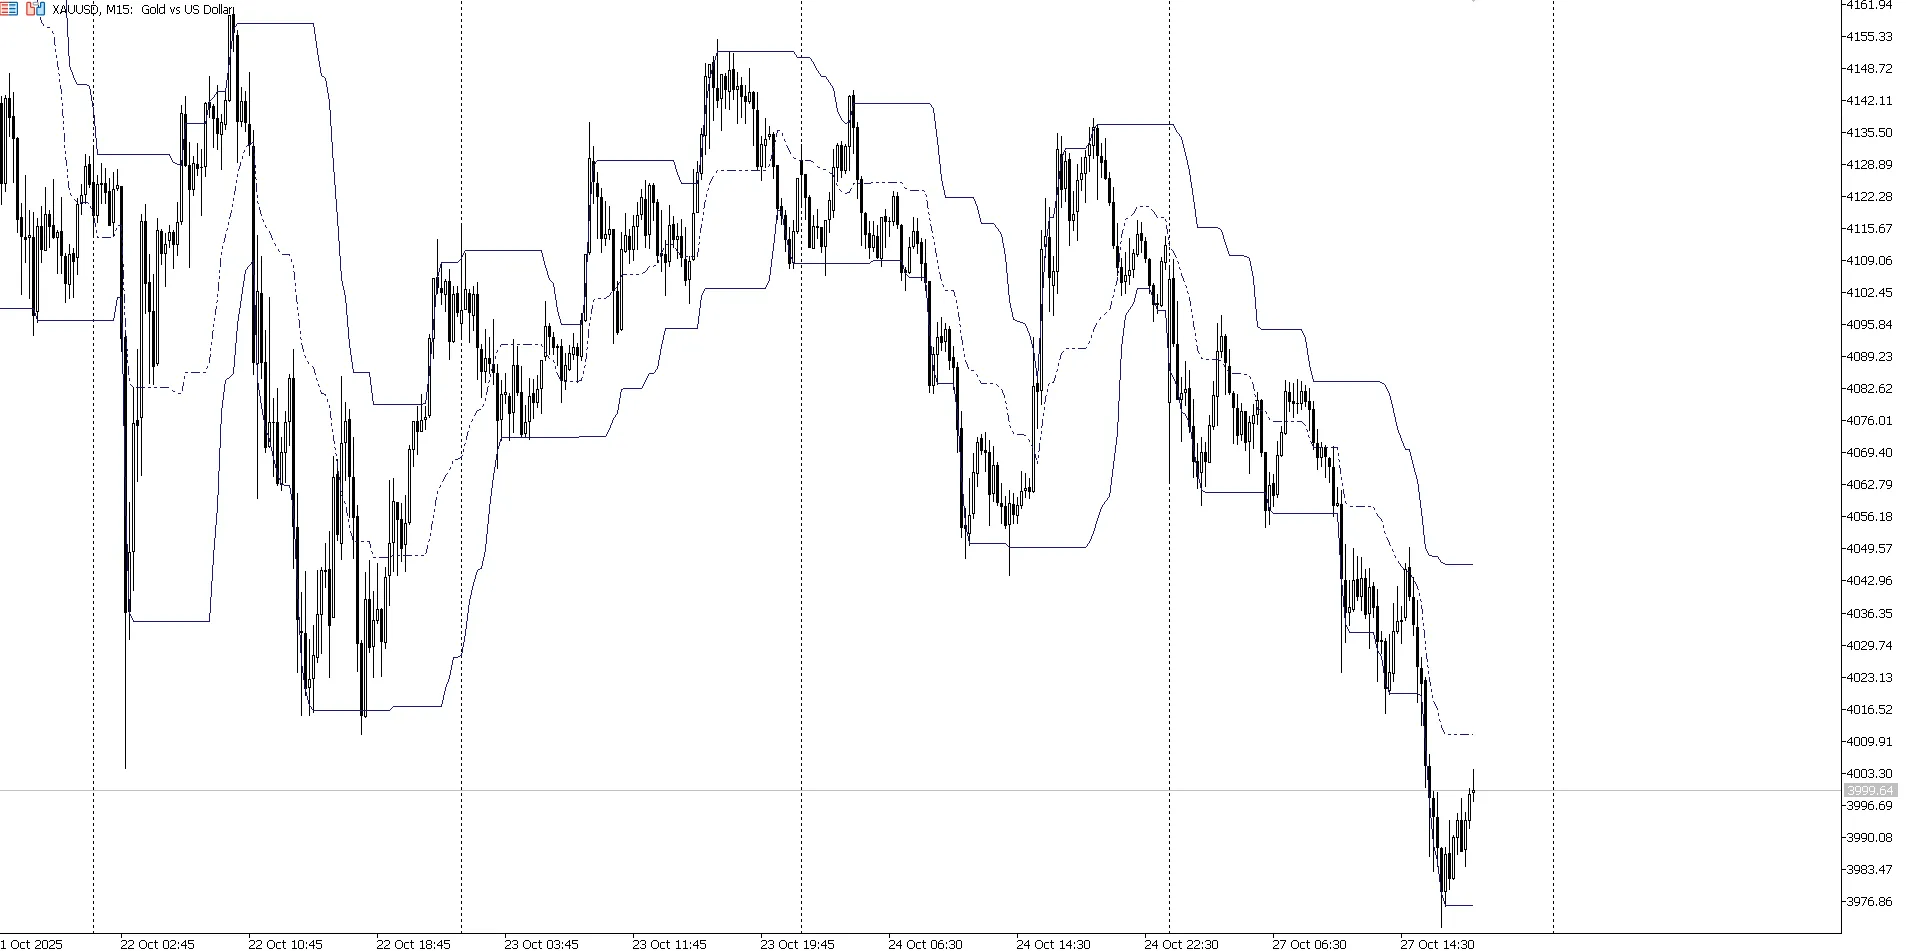
Understanding the Dynamic Gaussian Channel Indicator What is it? The Dynamic Gaussian Channel indica...
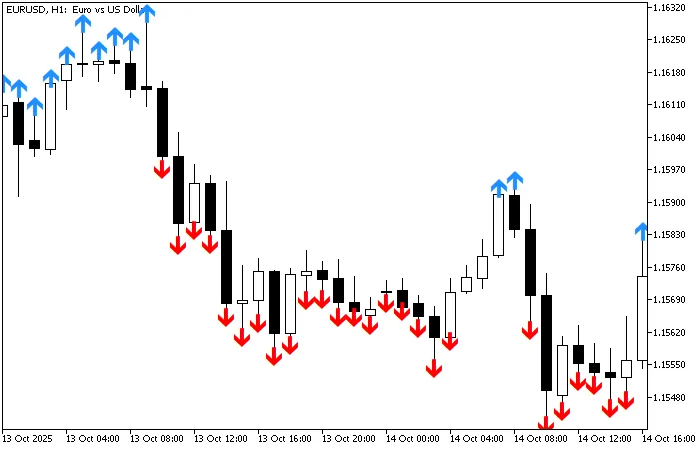
If you're looking for a straightforward yet powerful signal indicator for MetaTrader 5, you've lande...
Hey traders! If you’re looking to sharpen your charting skills, let’s talk about horizontal trend li...
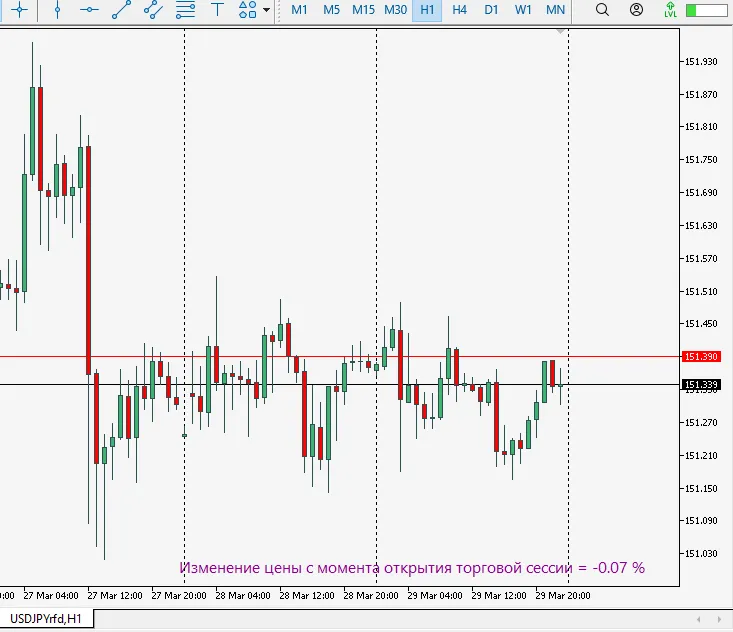
Hey there, fellow traders! Today, let’s dive into a super handy tool that can make your trading sess...
Hey there, traders! Today, let's dive into a powerful tool that can help you spot trend entries like...
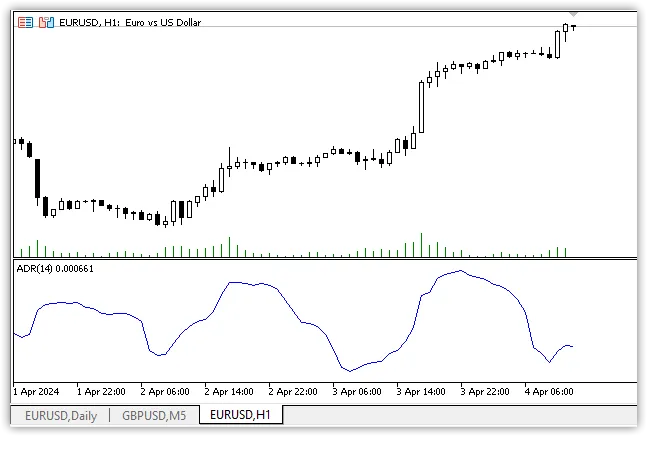
The Average Daily Range (ADR) is a valuable indicator that helps traders gauge the volatility of an ...
View Indicator Screenshot Author of the Idea: Alex Spiroglou, Code Author: OU Let’s dive into th...
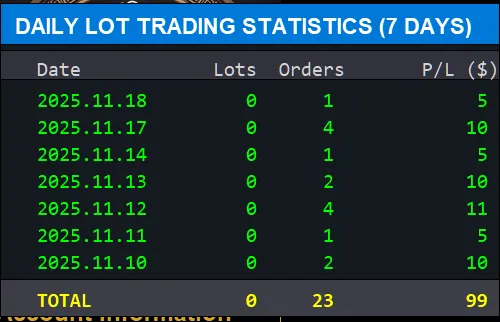
Key Features Daily Breakdown: Get insightful stats for the last 7 days (customizable to your needs)...
If you're diving into the world of trading, understanding patterns is crucial, and one of the most ...
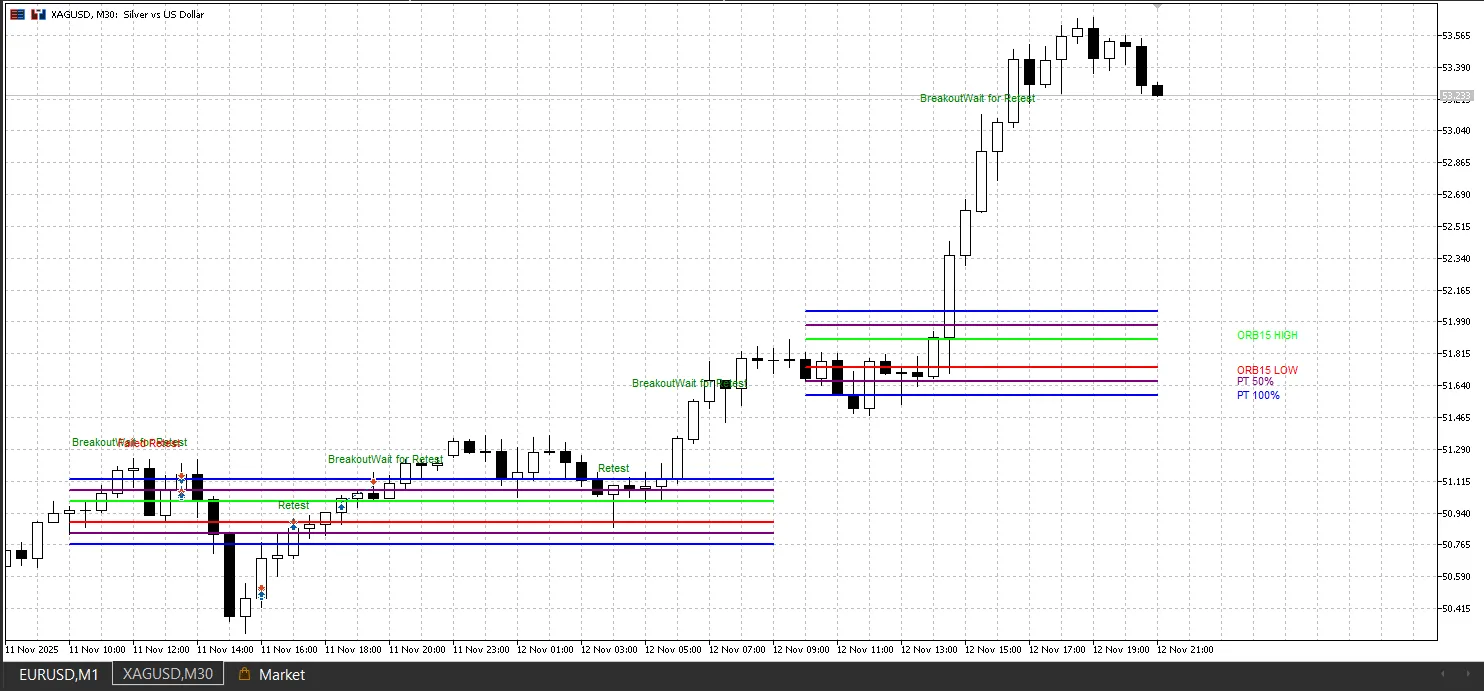
Overview The Open Range Breakout (ORB) indicator is a game changer for traders looking to pinpoint...
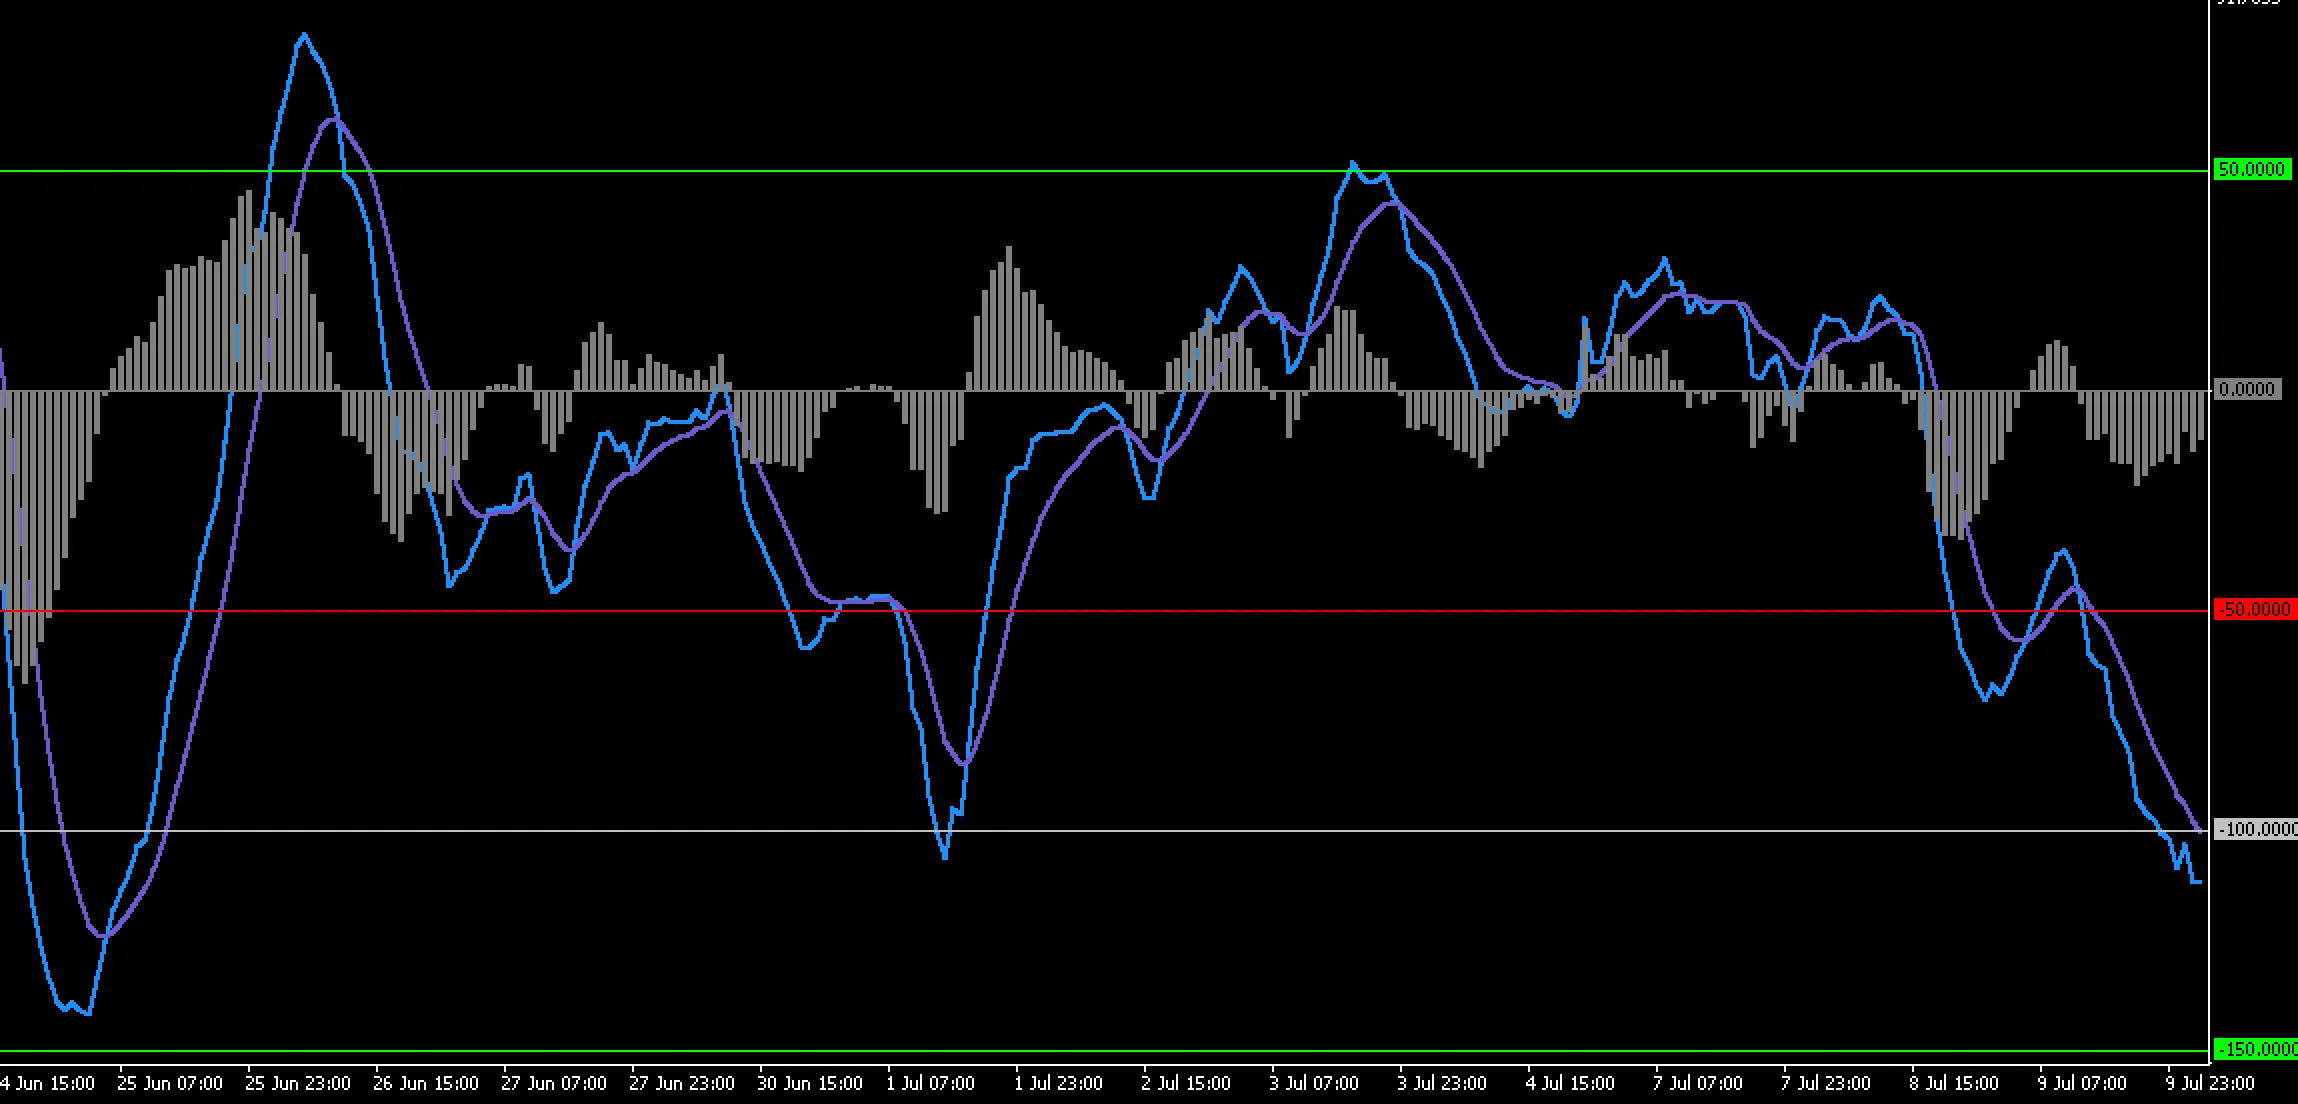
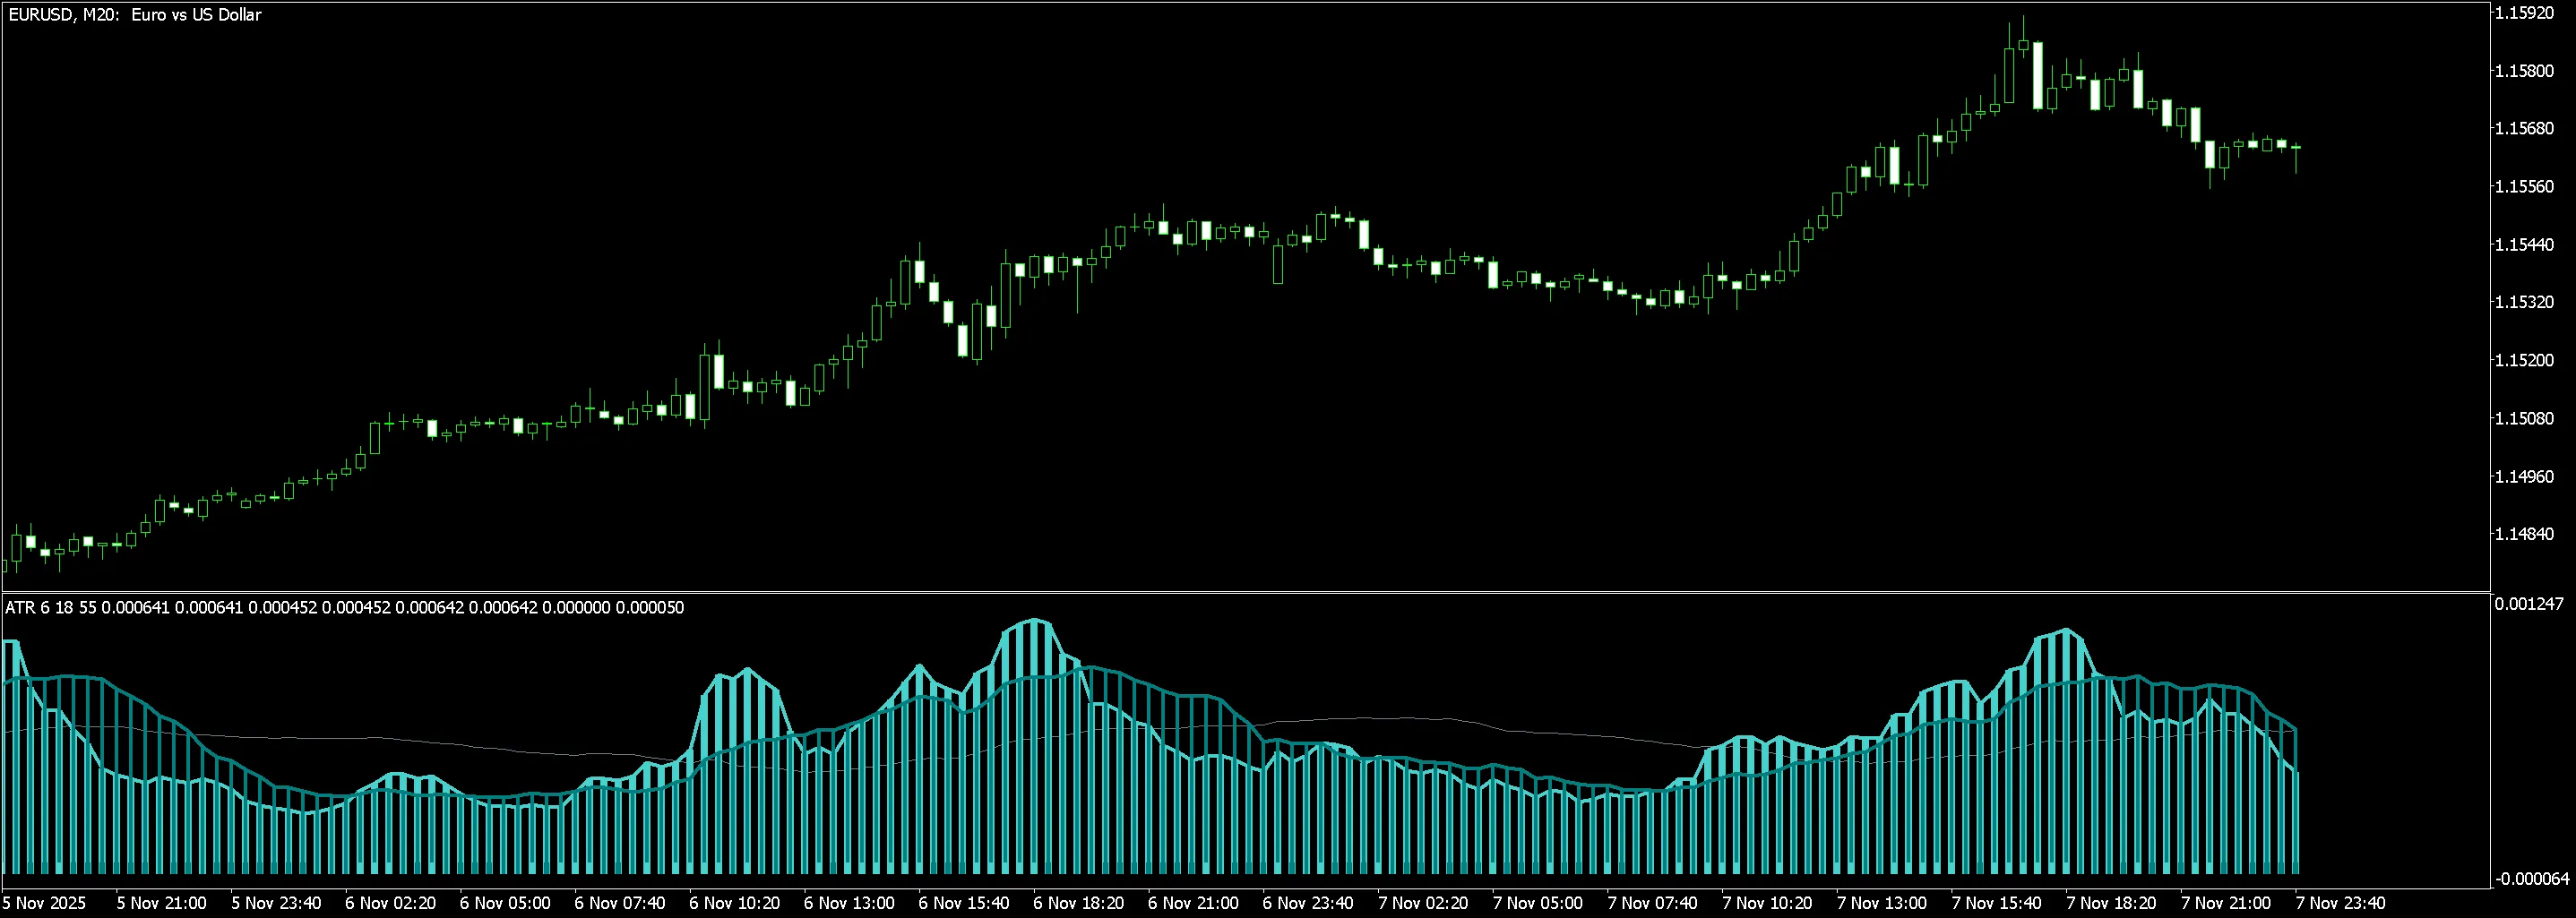
Hey fellow traders! Today, let's dive into the world of the ATR Cycles indicator, a valuable tool fo...
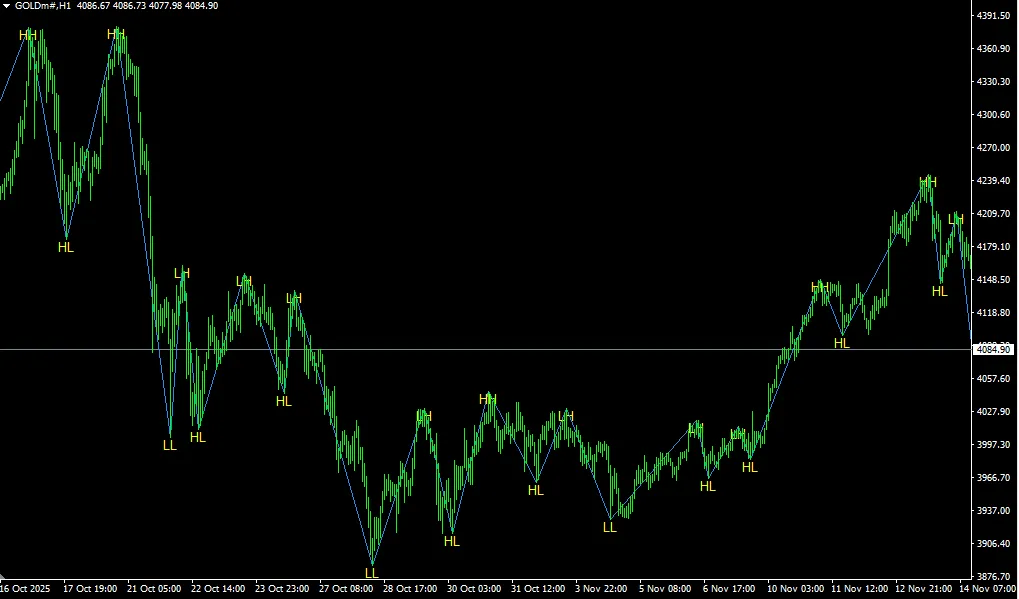
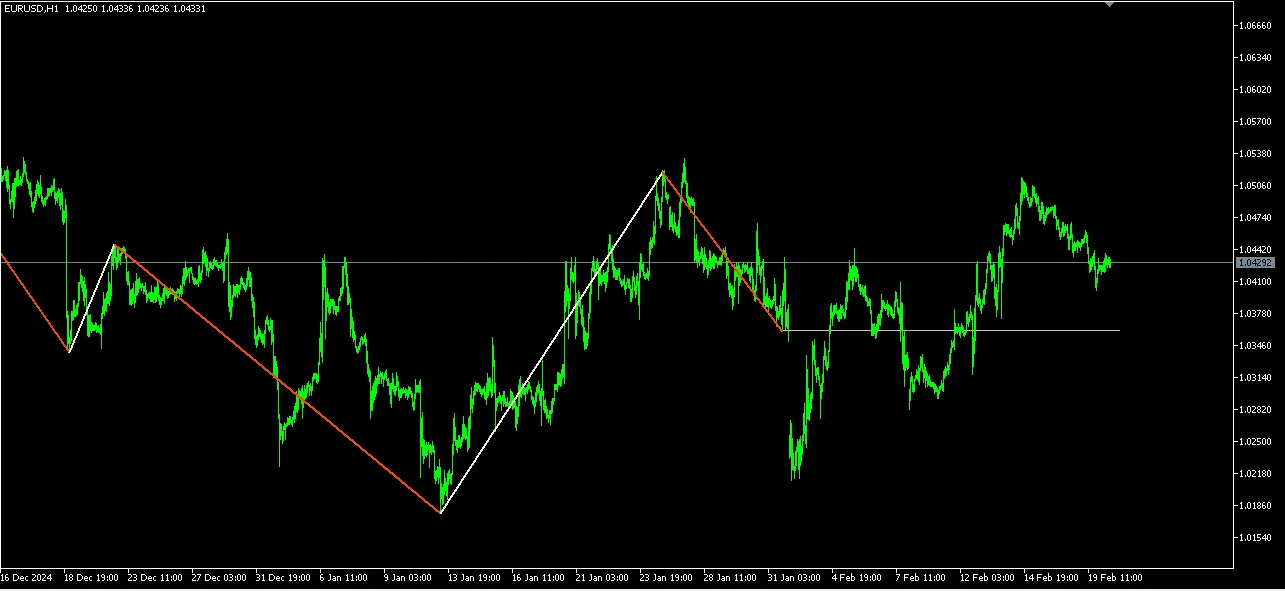
What is the Statistical Zigzag Indicator? The Statistical Zigzag indicator is a powerful tool for tr...
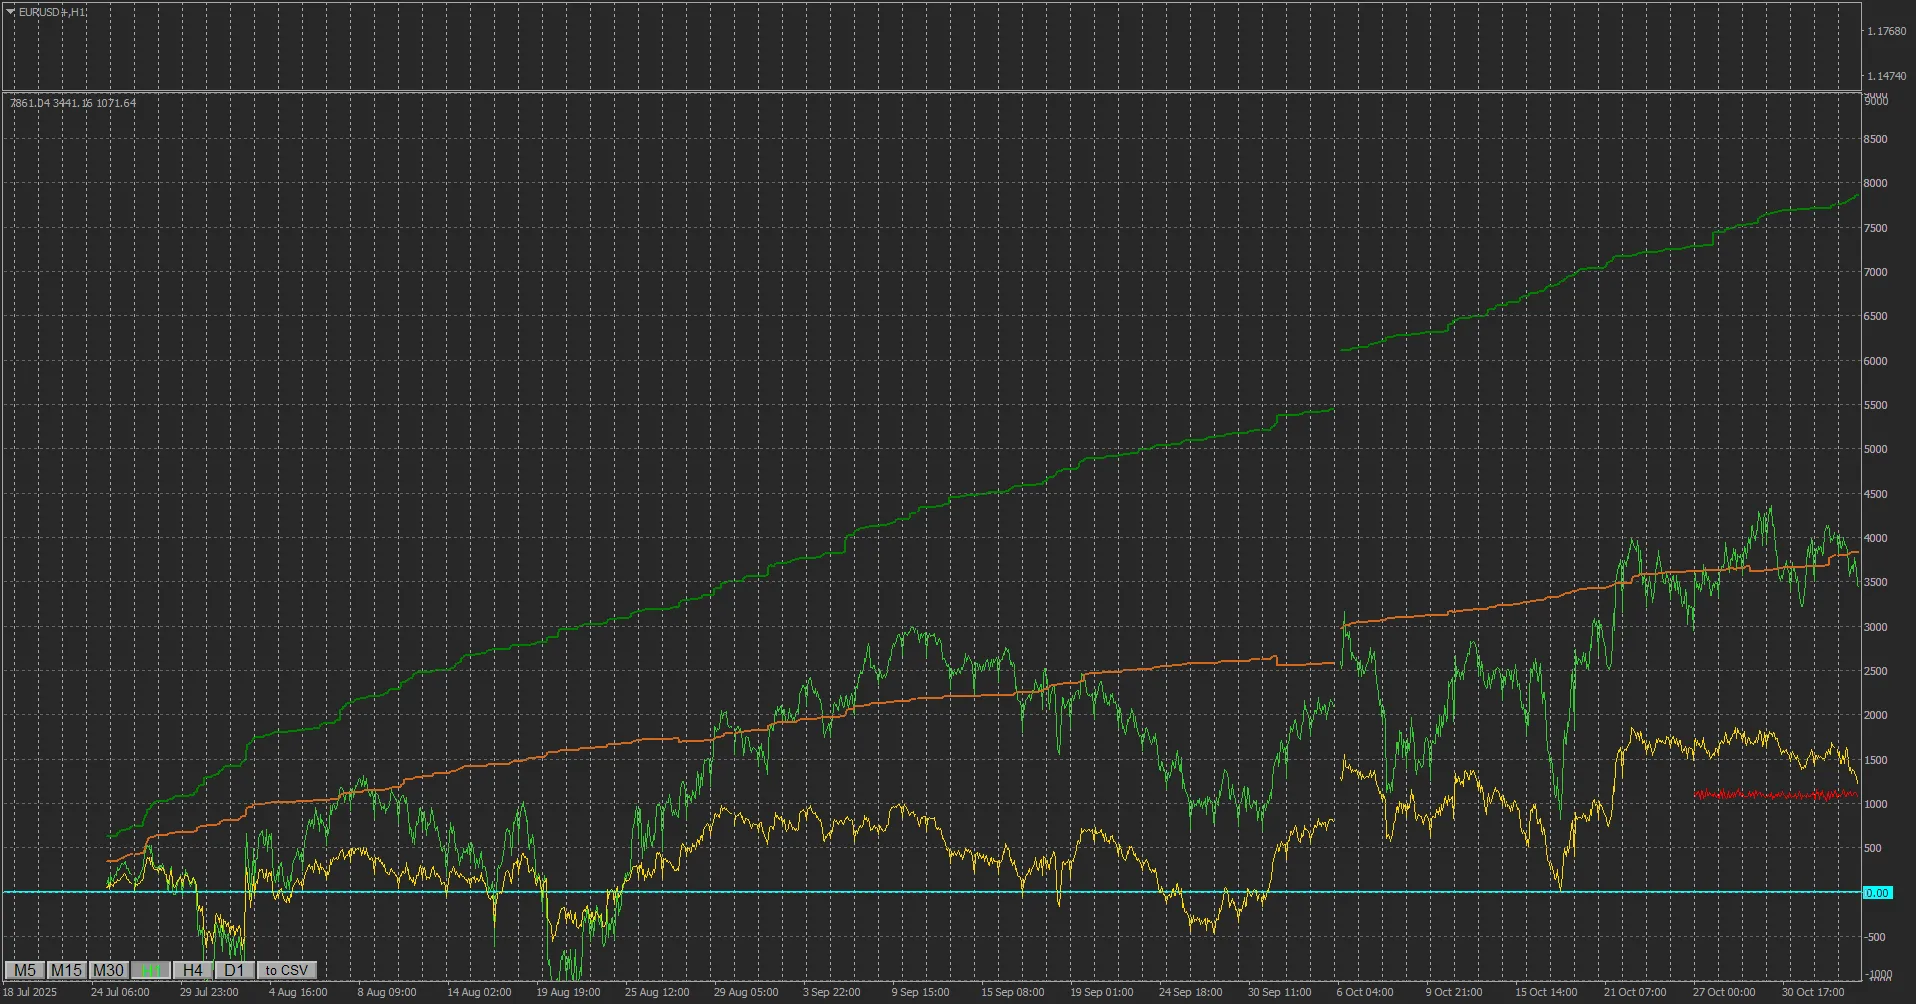
Unlock Trading Insights with the Data Collector Indicator If you’re looking to step up your trading...
Are you on the lookout for a powerful tool to enhance your trading game? Look no further! This free ...