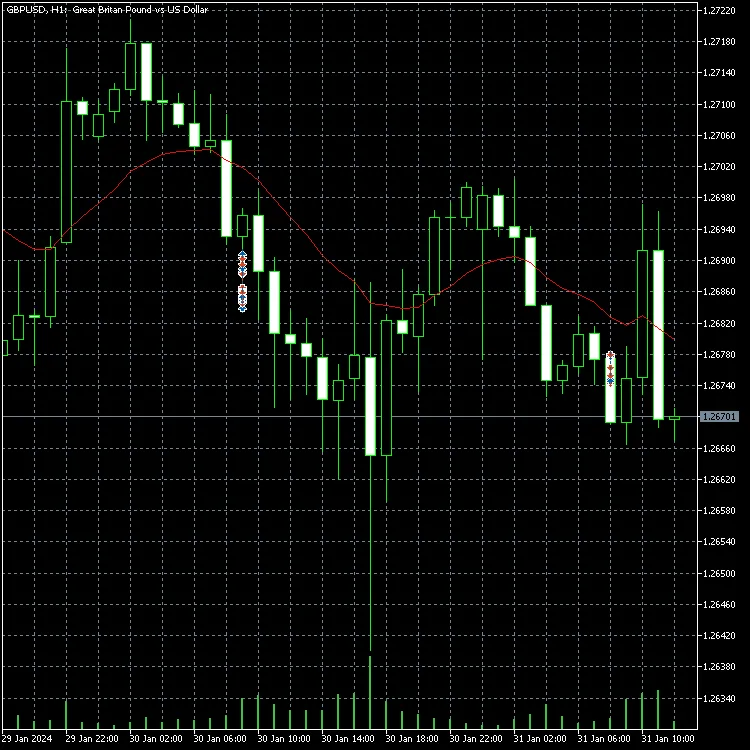
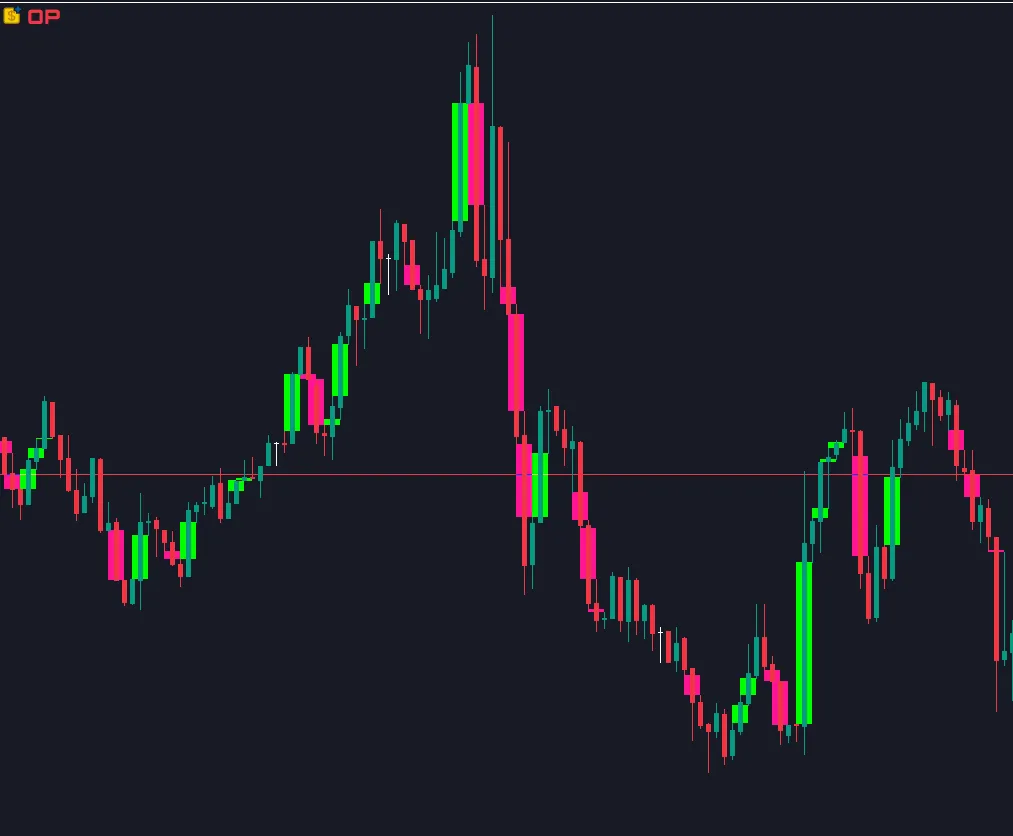
The Dominant Candle is a powerful two-candlestick pattern where the wicks intersect with each other'...
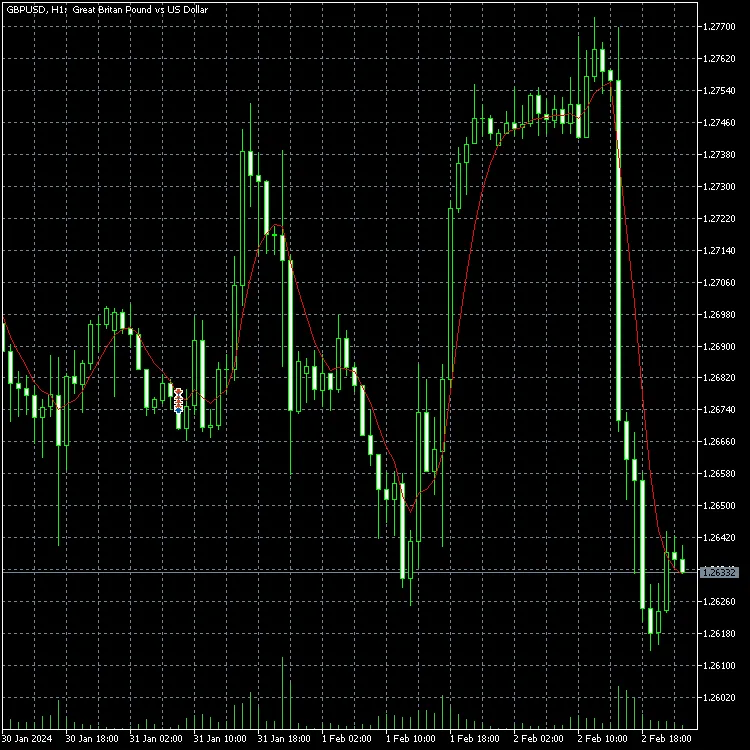
Hey fellow traders! Today, let's dive into something a bit different — the Logarithmic Moving Averag...
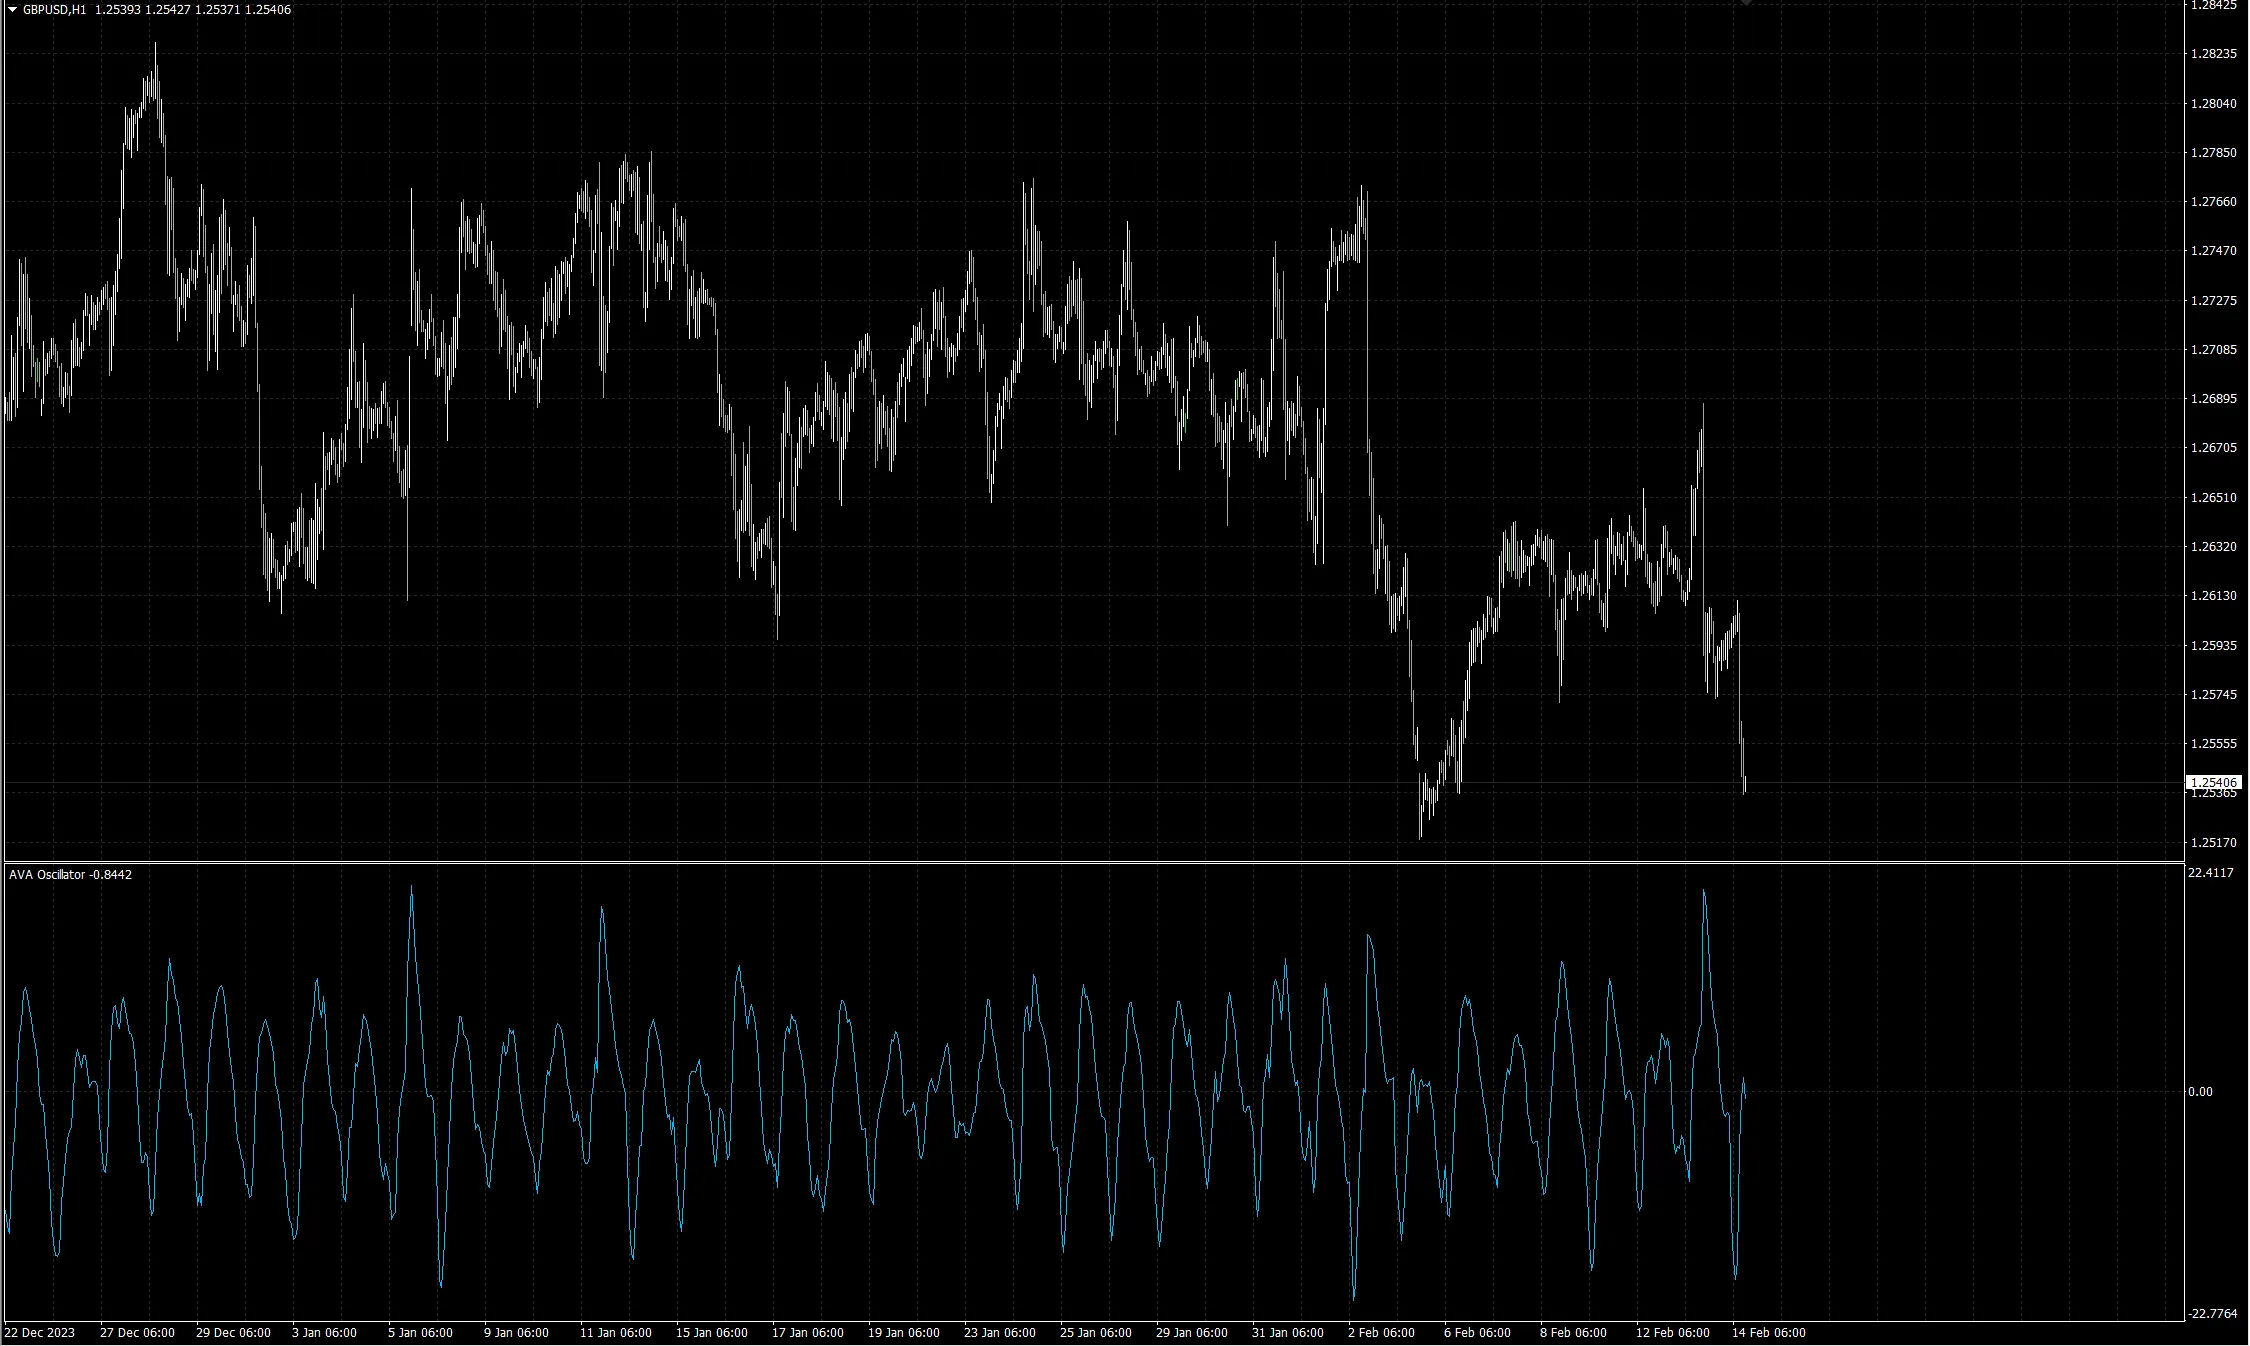
If you’re diving into the world of trading, you’ve probably stumbled upon various indicators that he...
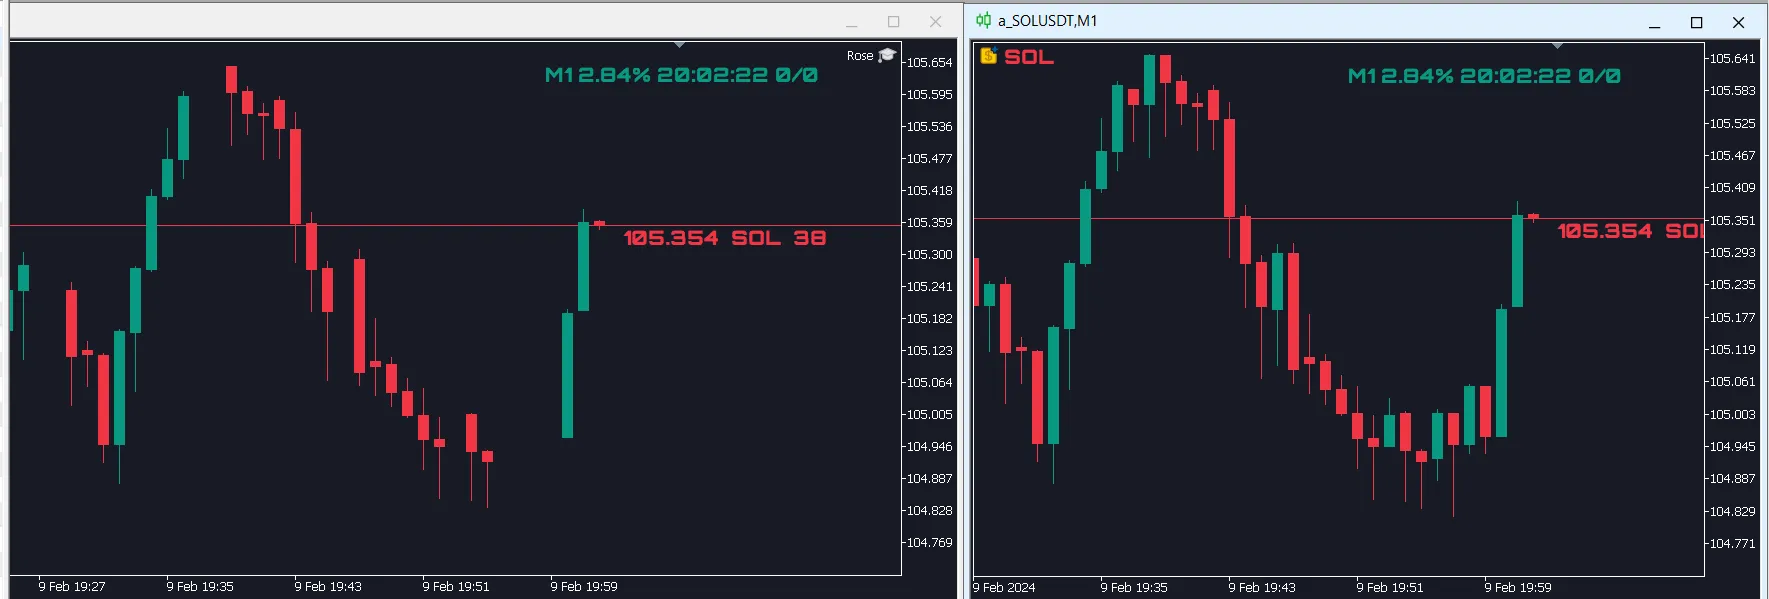
If you're looking to optimize your trading experience in MetaTrader 4, resizing your chart windows c...
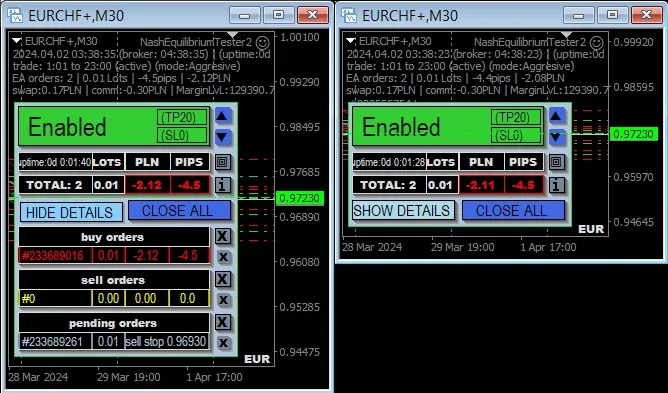
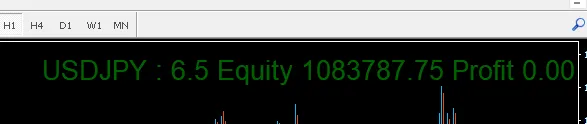
Are you looking for a way to streamline your trading experience? The Symbol Spread Equity Profit Ban...
Unlocking the Forex Market with the iForexSessions Indicator Keep track of Forex market sessions lik...
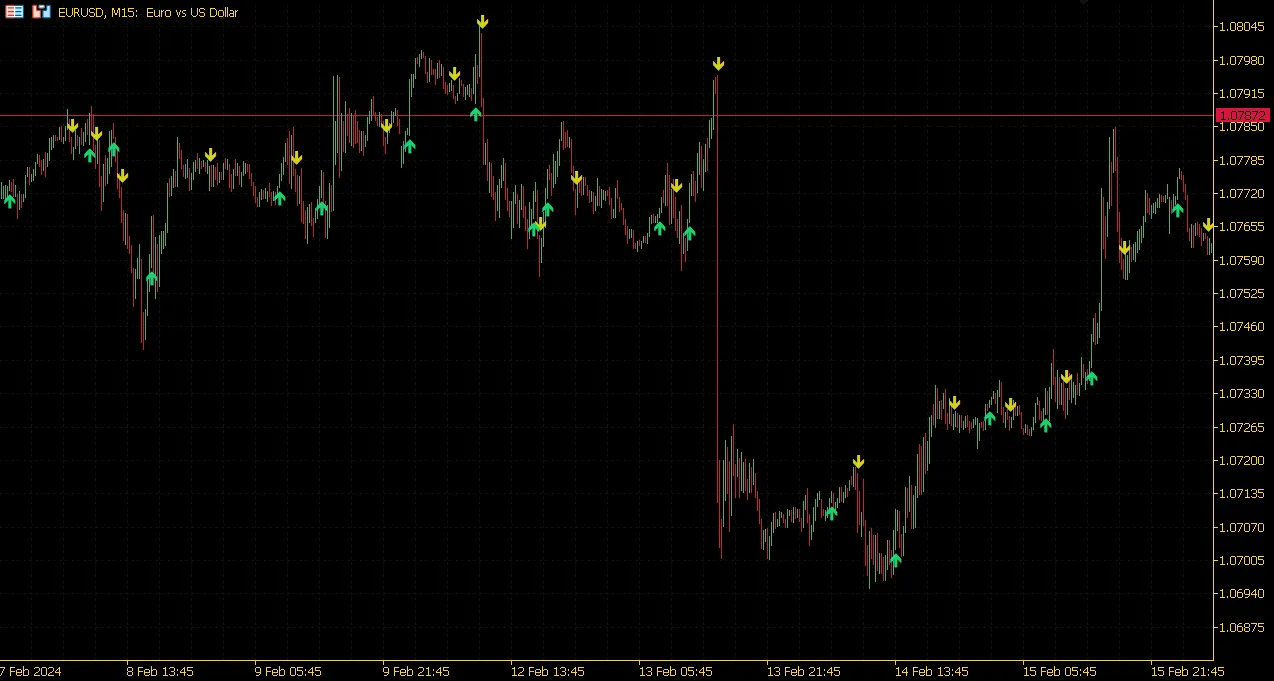
If you're trading on MetaTrader 5, you might want to check out the Slope Entry Points indicator. Thi...
Hey there, fellow traders! If you're looking to enhance your trading toolkit, you've come to the rig...
If you're looking to enhance your trading strategy on MetaTrader 5, understanding the difference bet...
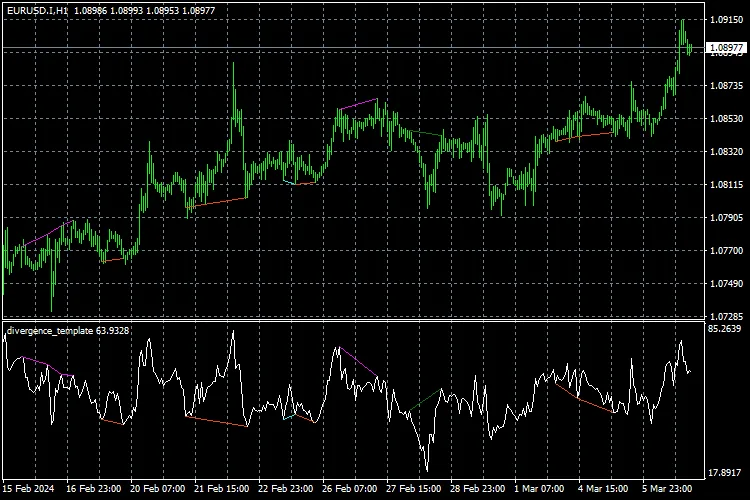
Understanding the Indicator Template The Divergences Template Indicator is designed to help you pl...
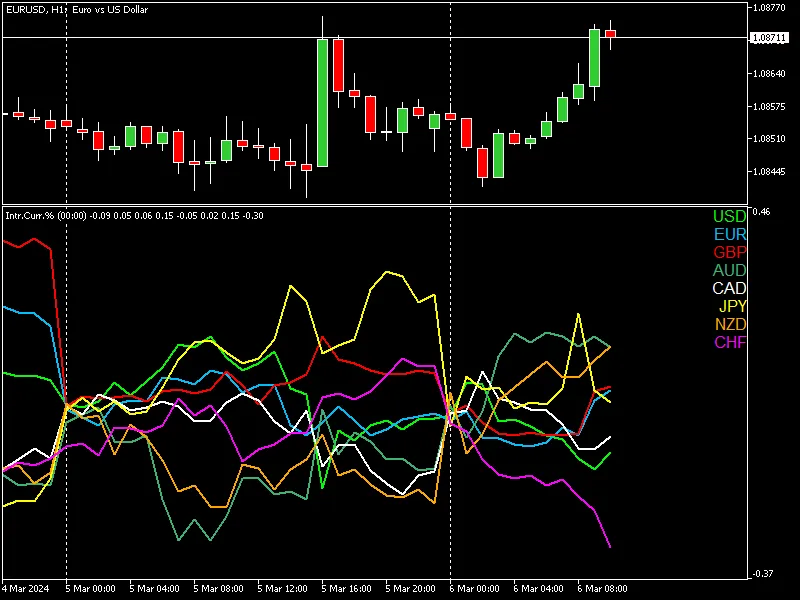
Get a Clear View of Individual Currencies Hey there, fellow traders! If you're looking to enhance ...
If you’re a trader looking to enhance your strategy, the SAR ADX Signal indicator for MetaTrader 5 m...
Understanding Historical Levels is crucial for any trader looking to gain an edge in the market. The...
Hey there, fellow traders! Today, I'm excited to introduce you to a powerful tool I developed called...
Hey traders! Today, let's dive into an interesting tool known as the Frog Jump Indicator for MetaTra...
Hey fellow traders! Today, let’s dive into something that’s been buzzing in the trading community—Fa...
If you’re looking to level up your trading game, the ATR Weighted Moving Averages indicator is a pow...
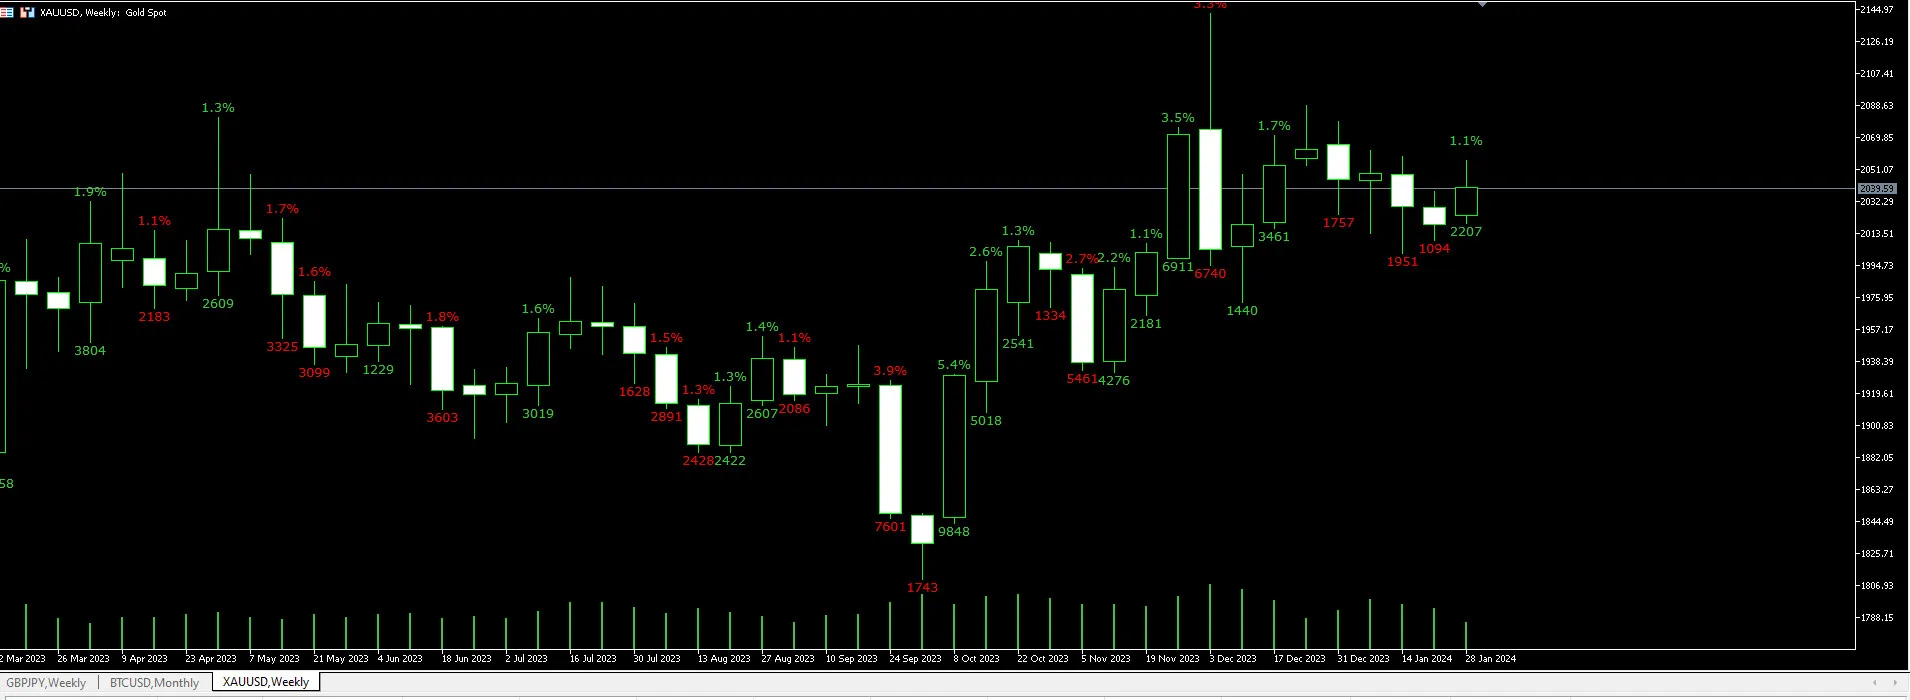
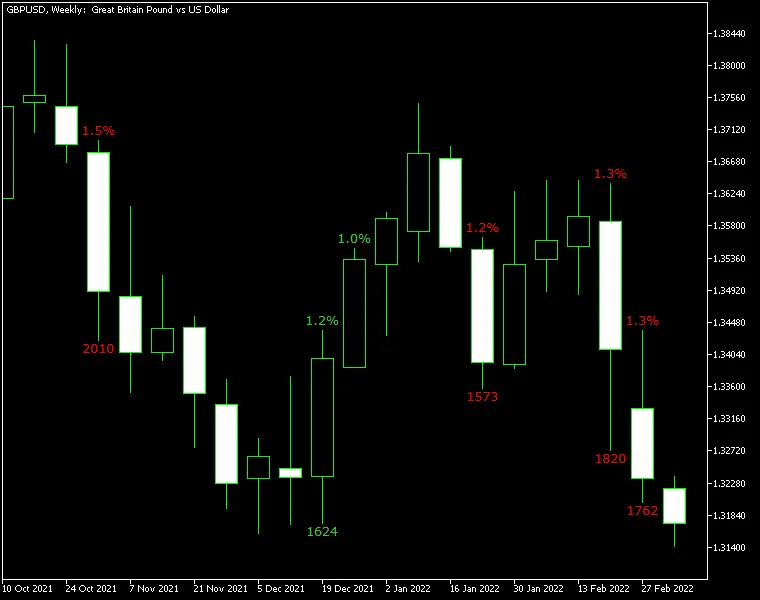
The Gain/Loss Candle Indicator is a powerful tool designed for traders using MetaTrader 5. It highli...
Hey there, fellow traders! If you’re looking to enhance your trading game, let me introduce you to a...
If you’re looking to level up your trading game, you might want to check out the Candle Fitness Indi...