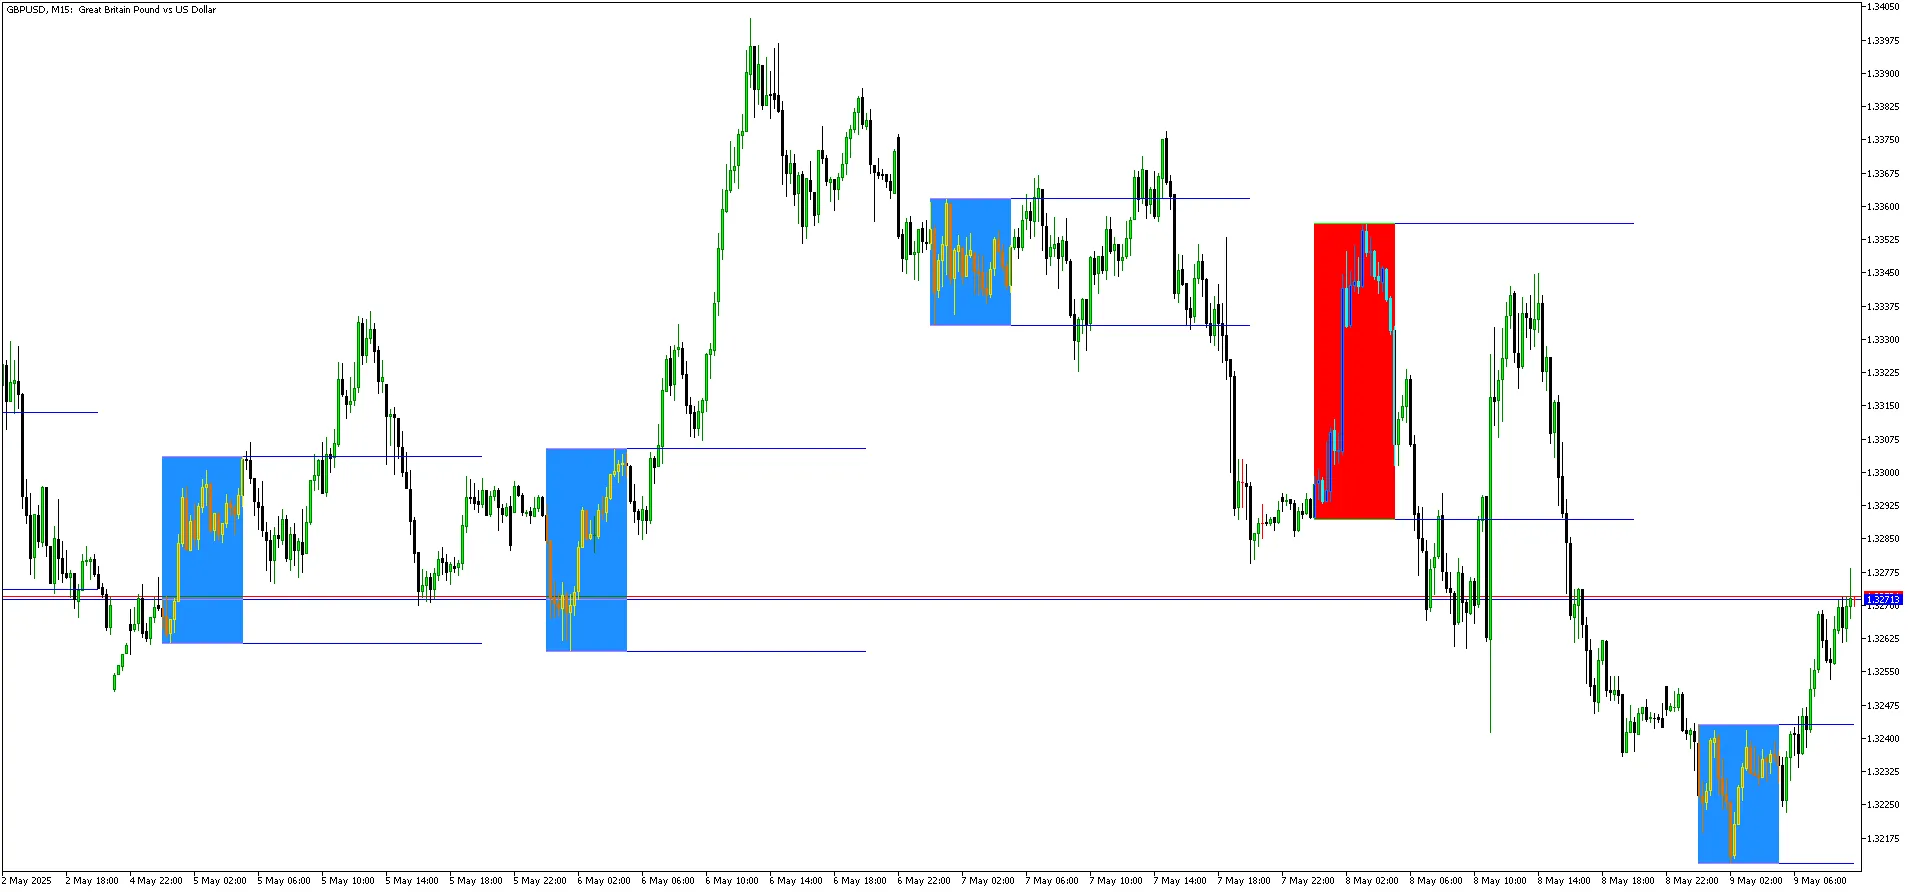
Hey fellow traders! Today, we're diving into the Range Breakout Indicator specifically designed for ...
Hey fellow traders! Today, let’s dive into a powerful tool that can enhance your trading game: the M...
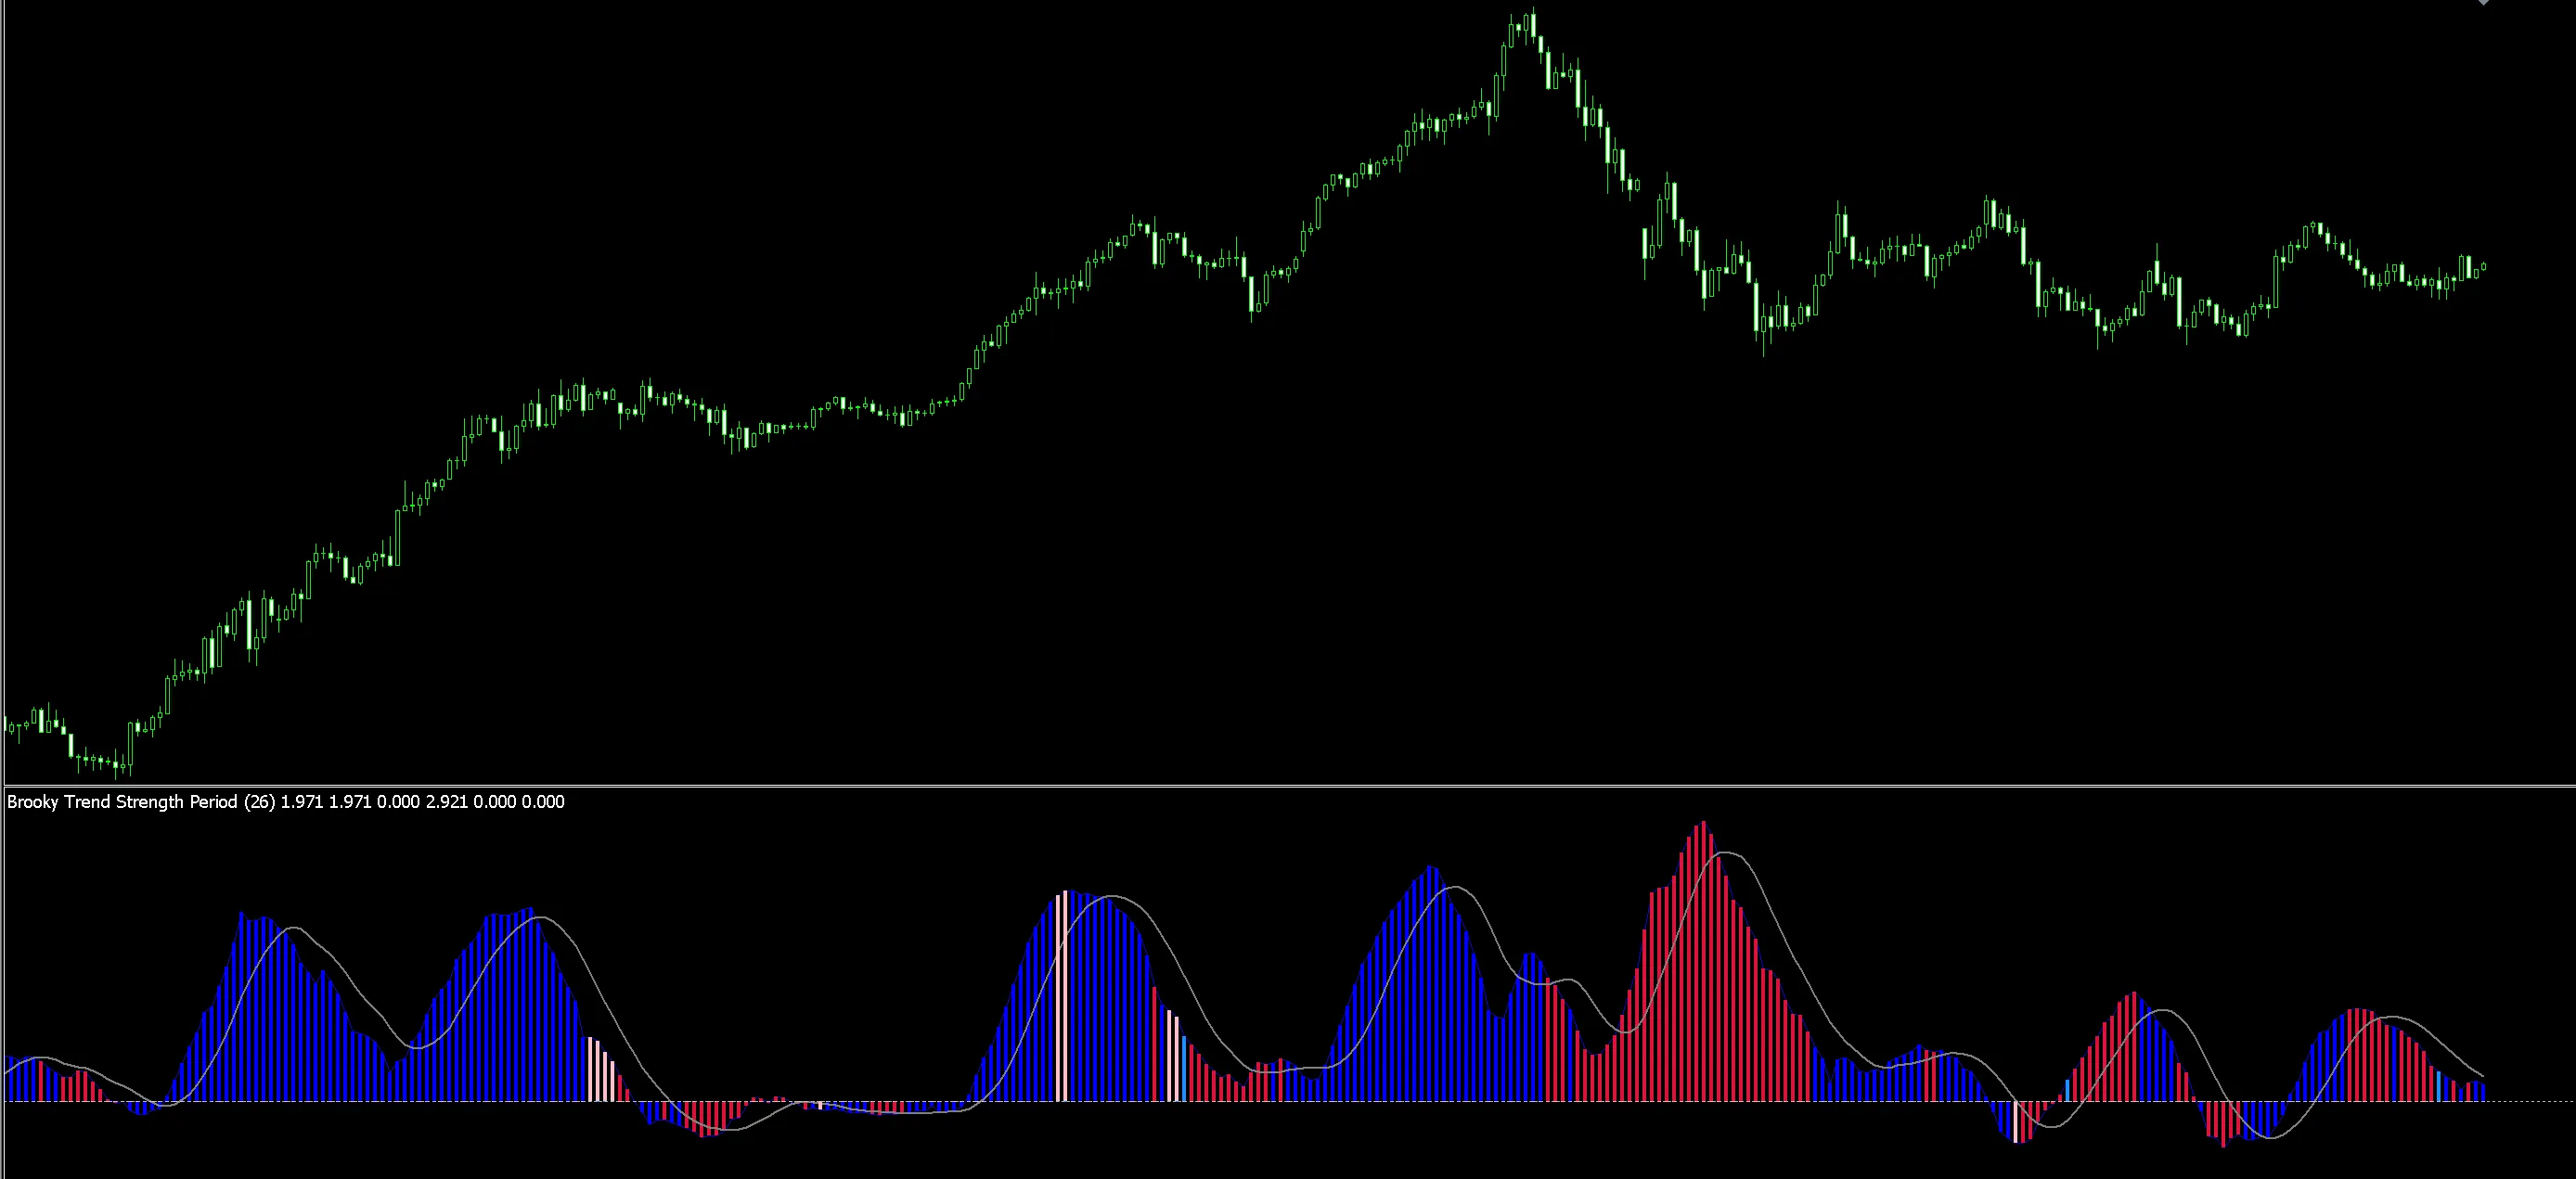
The Brooky Trend Strength Indicator is a powerful tool that integrates seamlessly with MetaTrader 5....
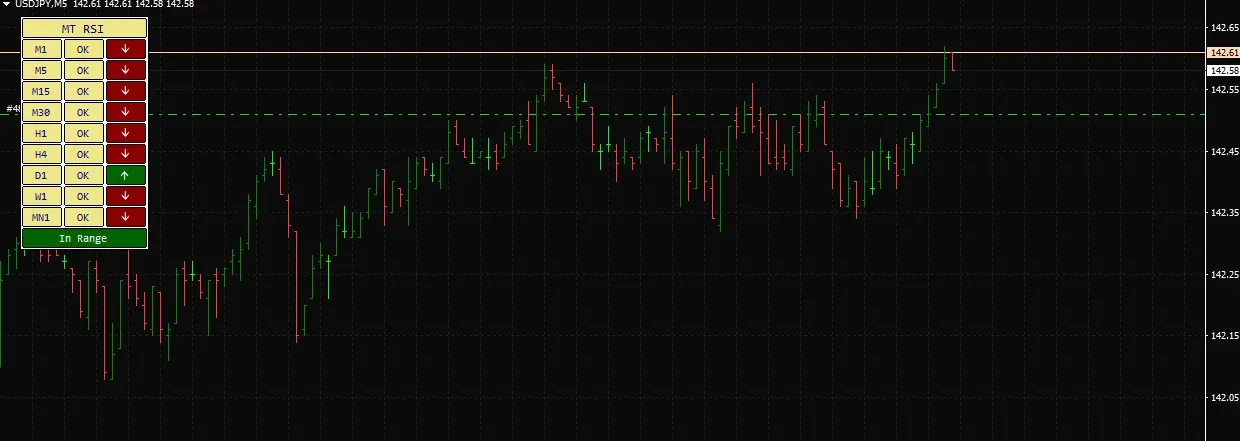
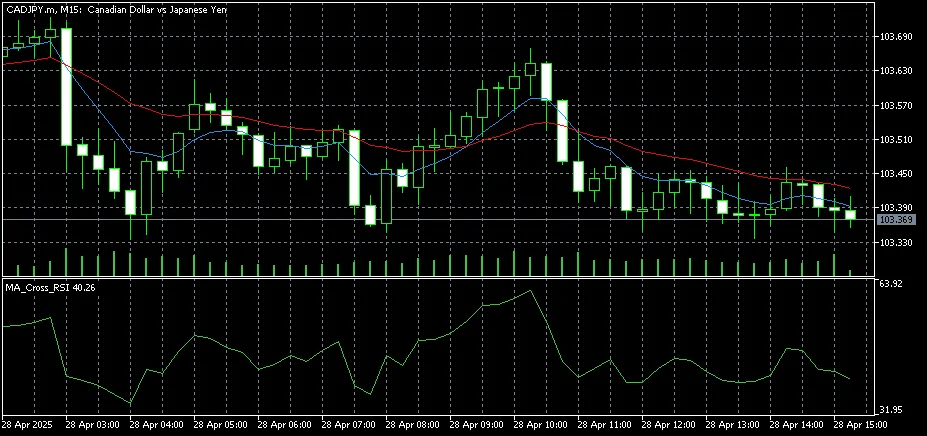
If you're looking to gain an edge in your trading, the RSI Timeframe Analyzer is a must-have tool fo...
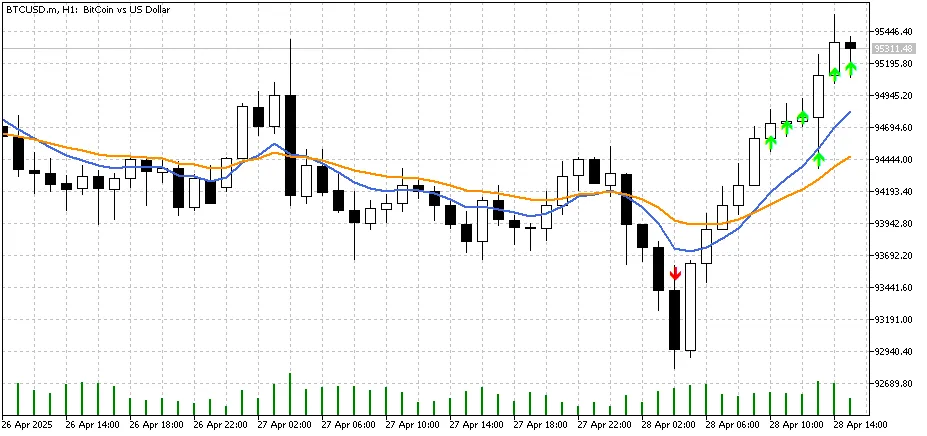
If you're trading in the fast-paced world of GOLD and BITCOIN, you know how crucial it is to have th...
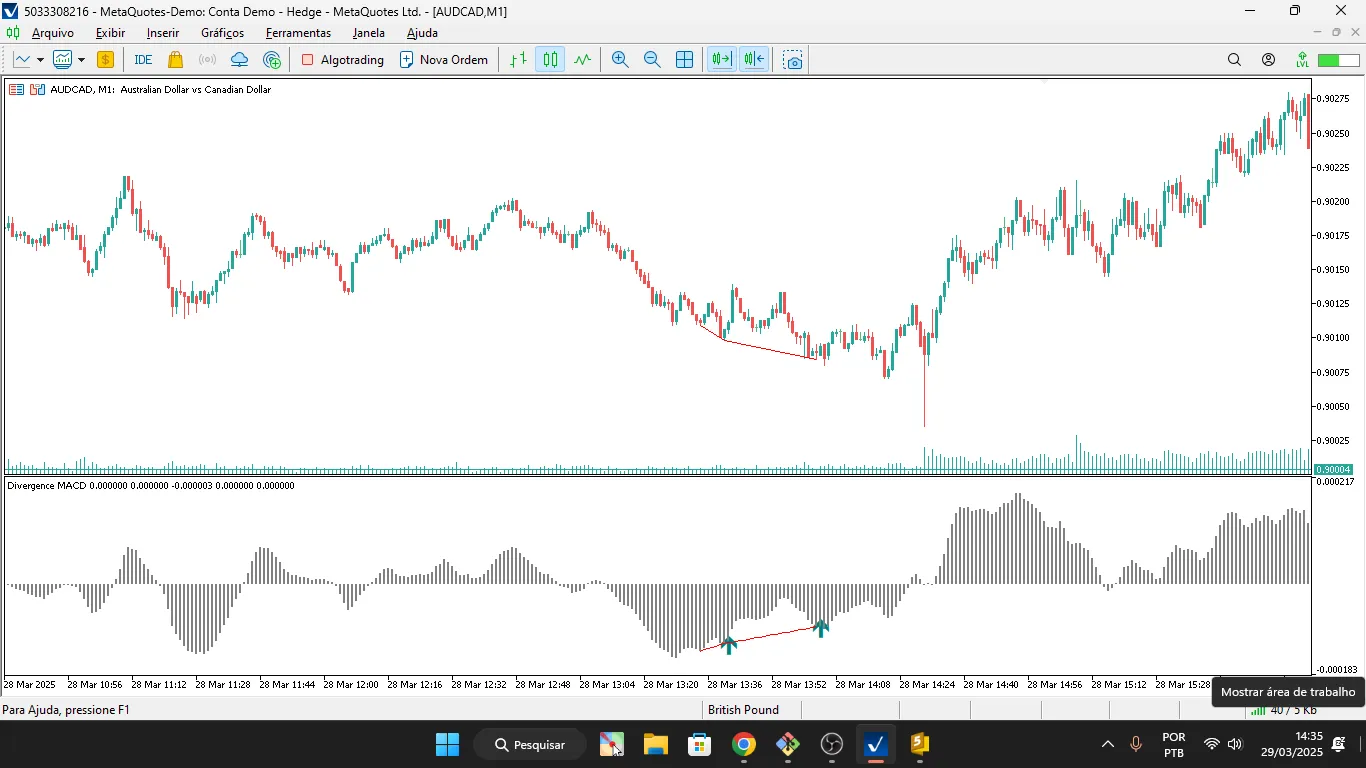
View Indicator Chart Hey there, fellow traders! If you're looking for a powerful tool to help you sp...
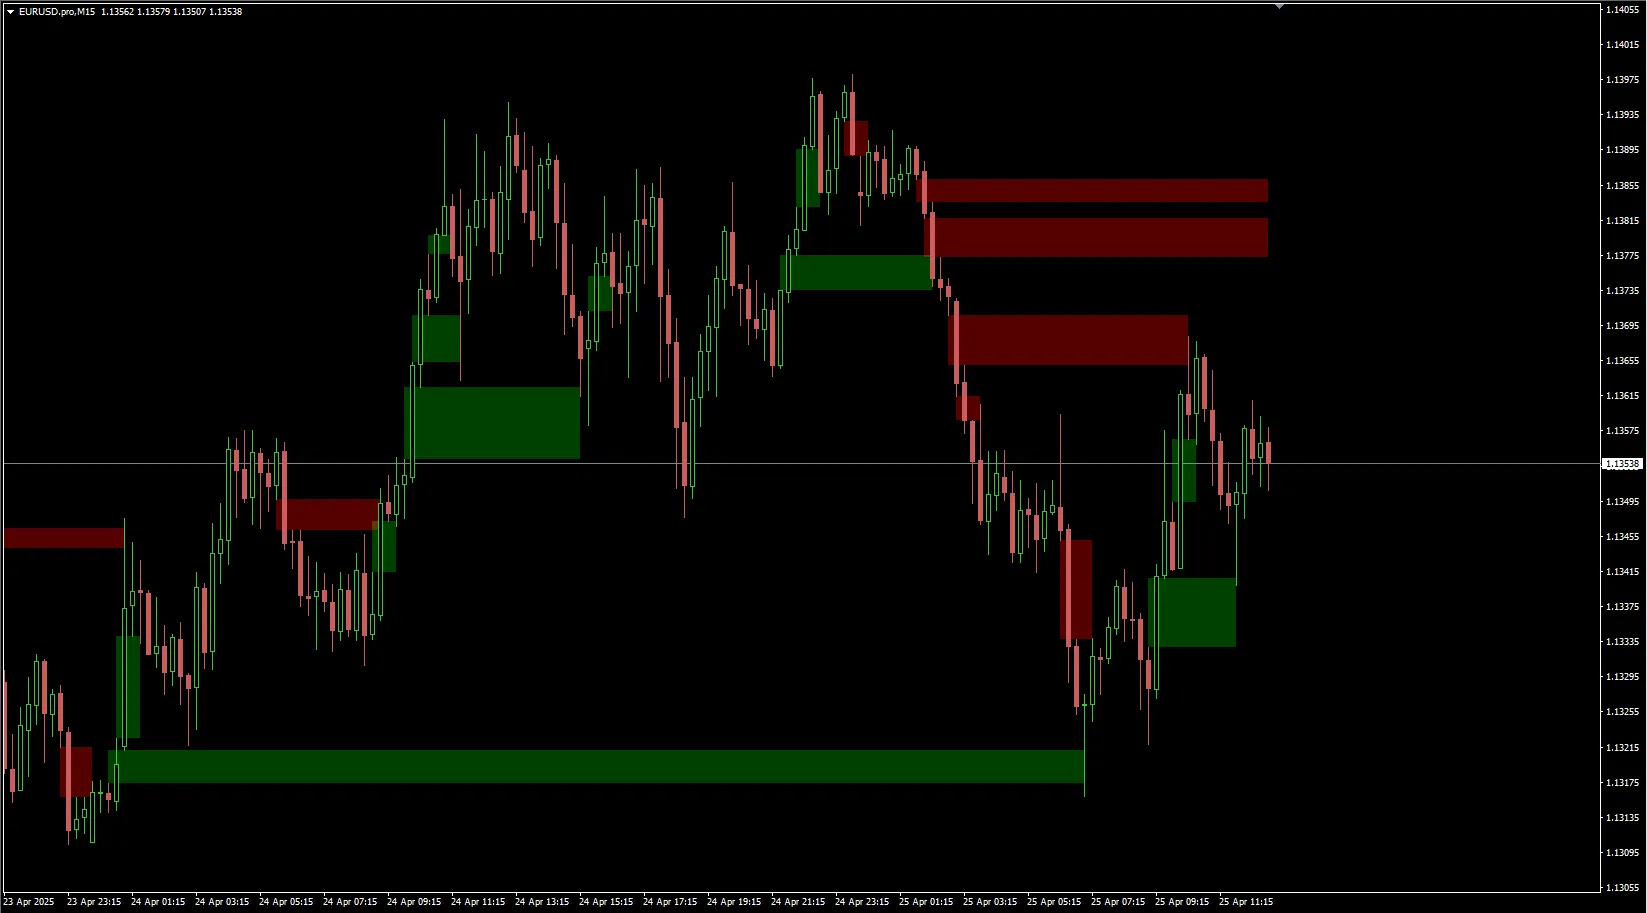
What Are Fair Value Gaps? Hey there, fellow traders! Today, we’re diving into a crucial concept tha...
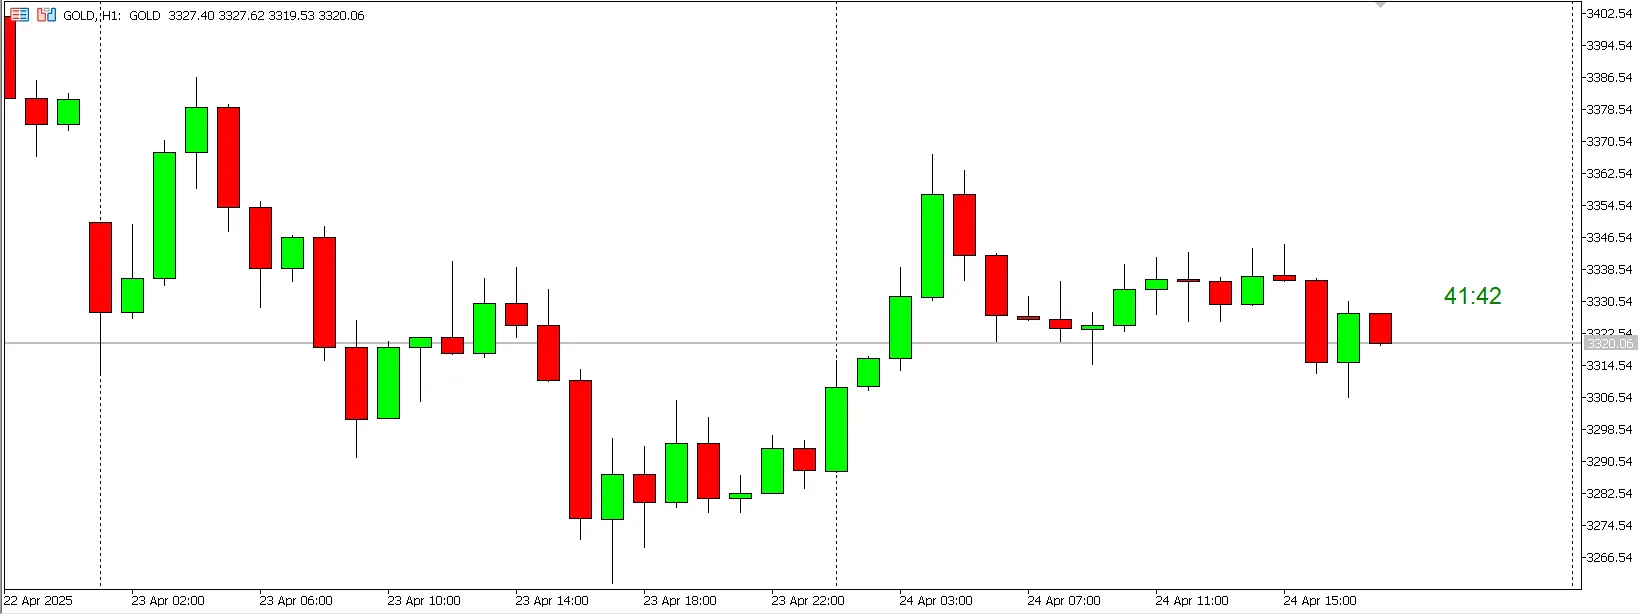
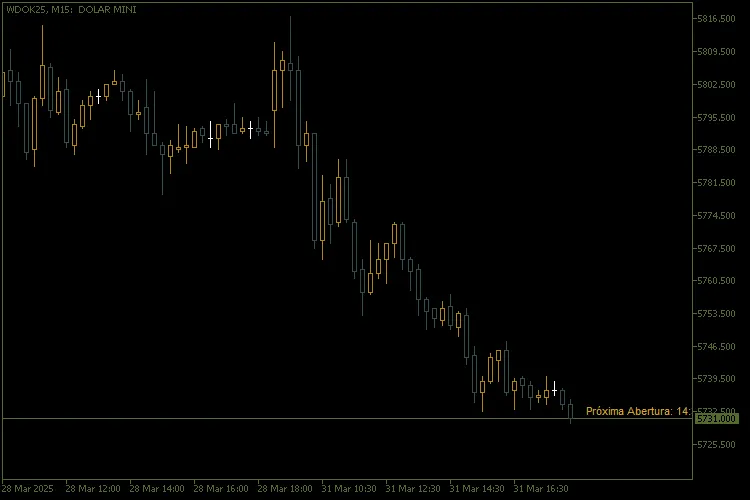
Ever found yourself wondering how much time is left on your current candle? The CTJM Candle Timer is...
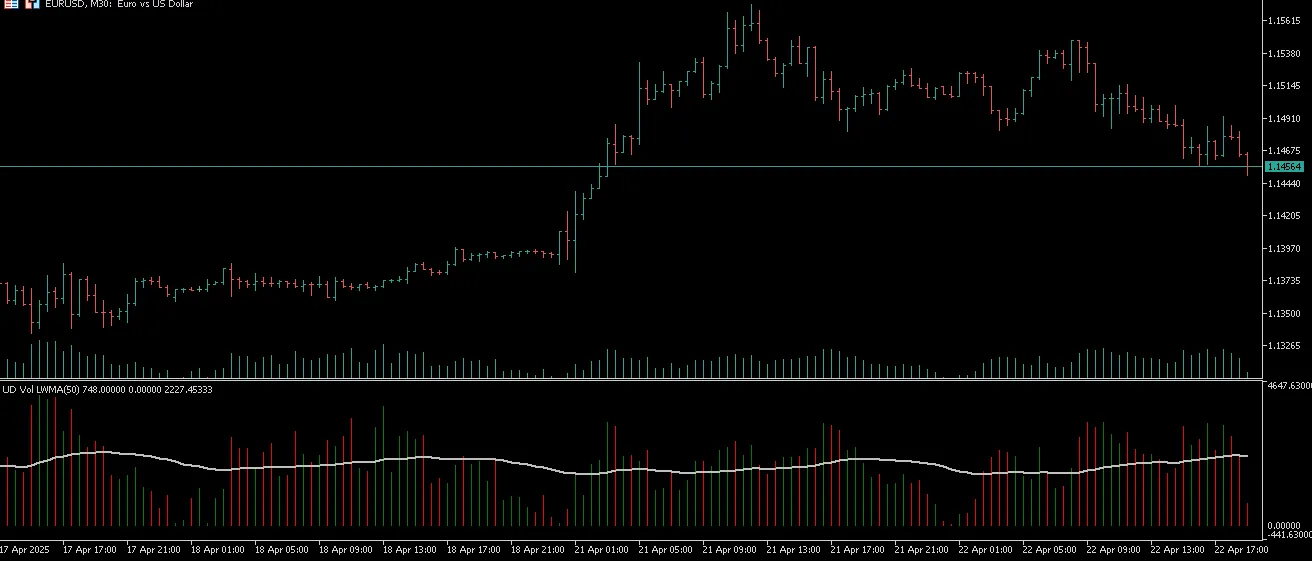
If you’re on the hunt for a solid way to analyze market trends, the Volume MA with candle color trac...
Key Features 1. Flexible Display Modes: - Commentary: The countdown appears right in the top left co...
What is Spread in Trading? In the trading world, a spread refers to the difference between the bid a...
Hey there, fellow traders! If you're looking to enhance your trading strategy, you might want to che...
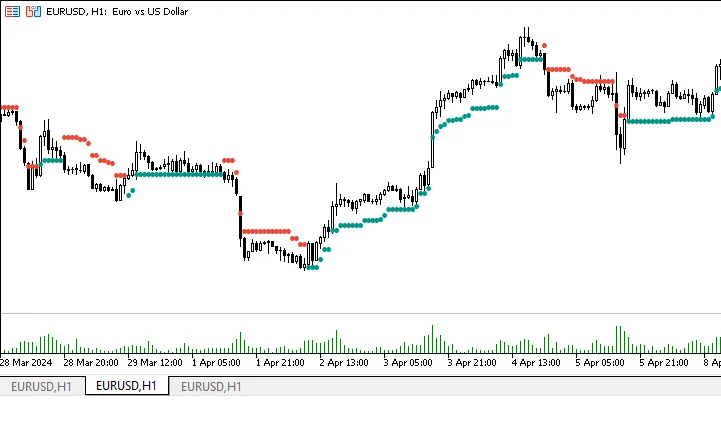
Volatility Stop is a powerful technical indicator designed to help traders set effective stop losses...
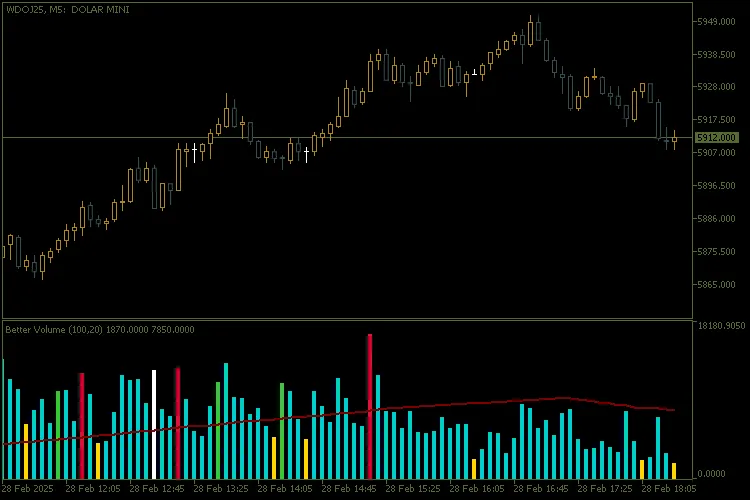
Main Features Dynamic Volume Categorization: The indicator sorts volume into various categories,...
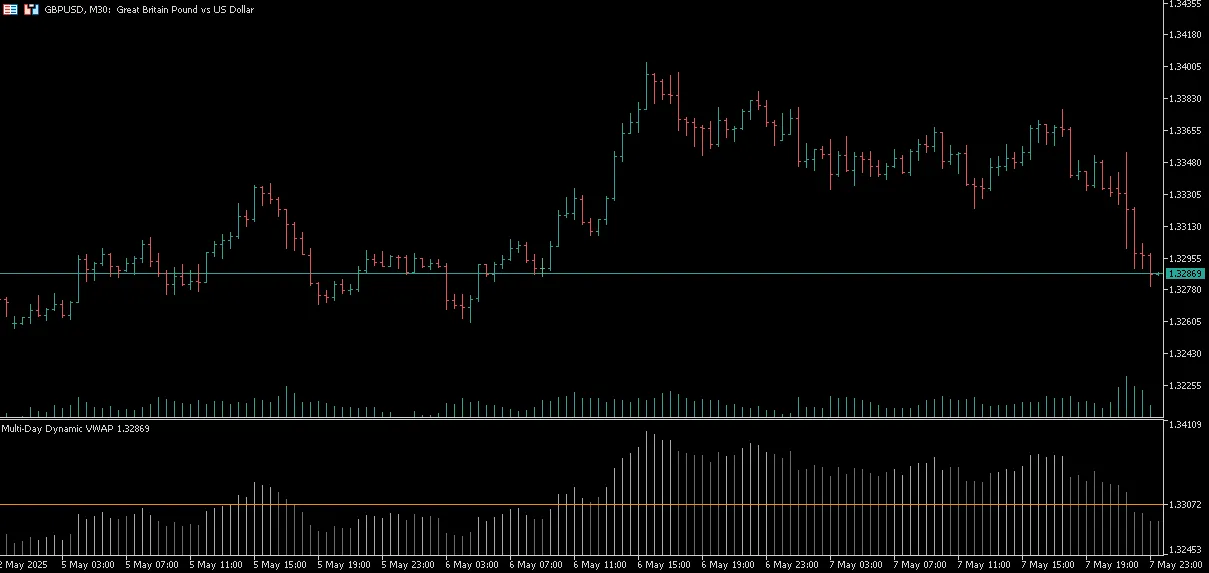
MQL5 Indicator for Calculating the Average Price of a Hedge Account Introduction Hey there, fellow ...
Chaikin Money Flow (CMF) is a powerful technical analysis tool that helps traders gauge the cash flo...
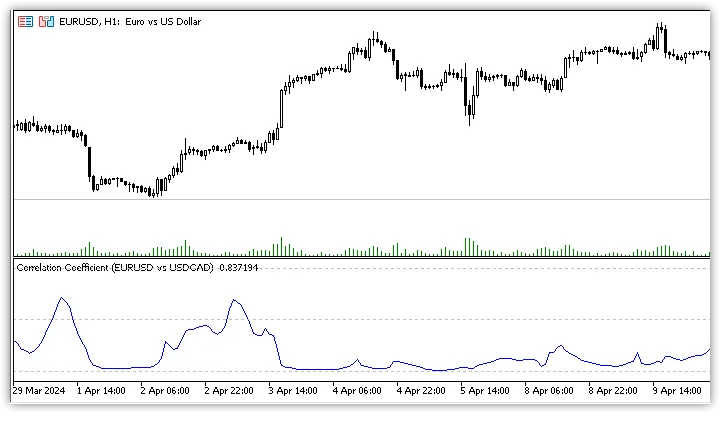
The correlation coefficient (CC) is a key statistical tool that helps traders measure the relationsh...
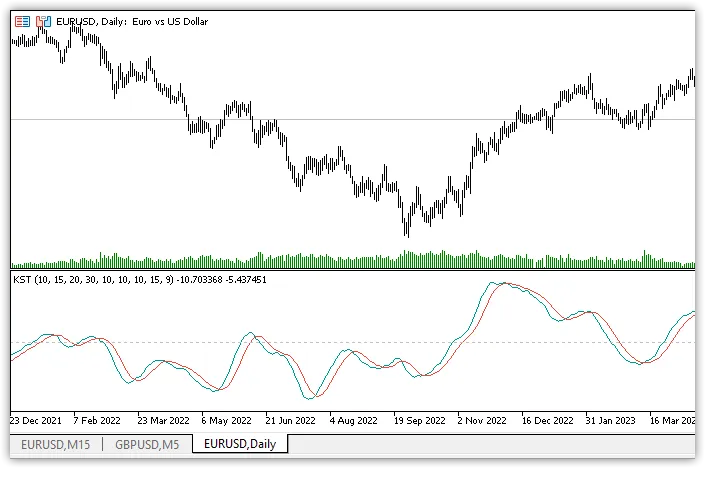
The Know Sure Thing (KST) indicator is a powerful oscillator that traders use to gauge momentum thro...
What is the Net Volume Indicator? The Net Volume Indicator is a handy tool that helps you gauge th...
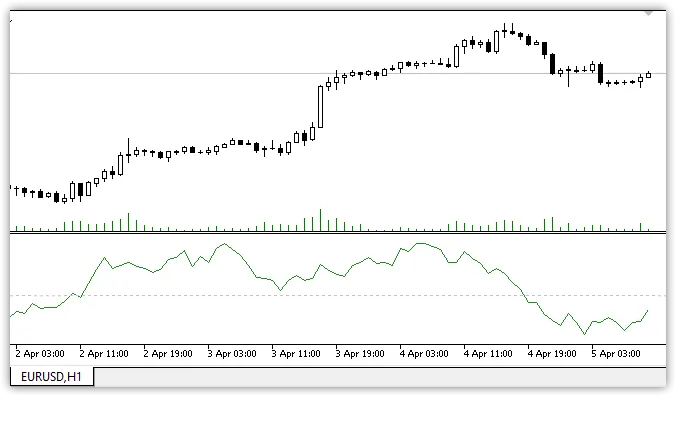
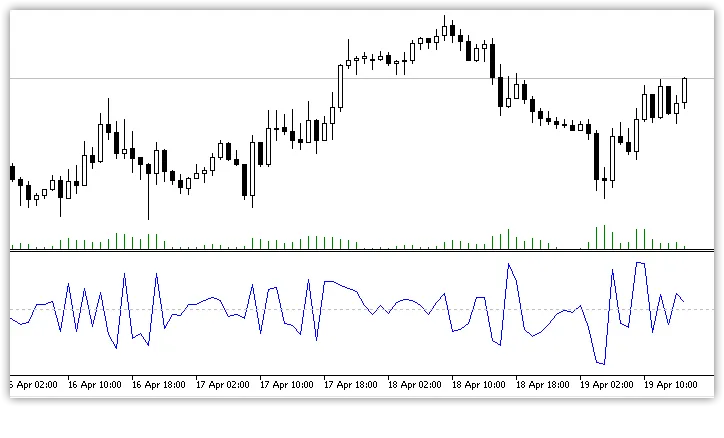
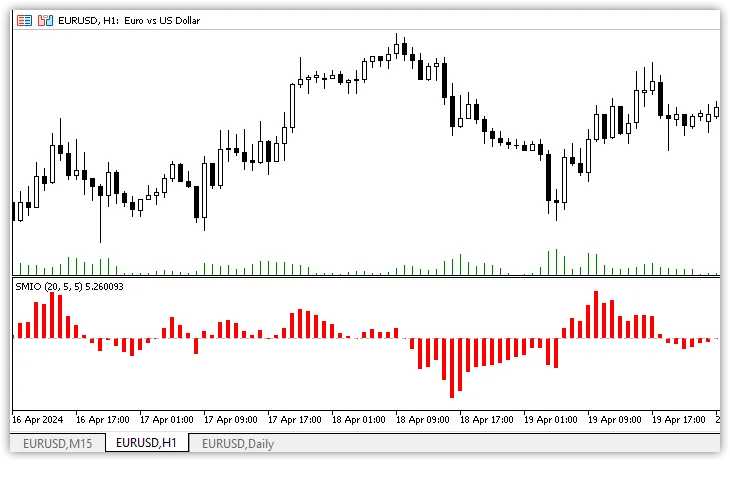
The SMI Ergodic Oscillator is a powerful tool that helps traders gauge market momentum by showing th...