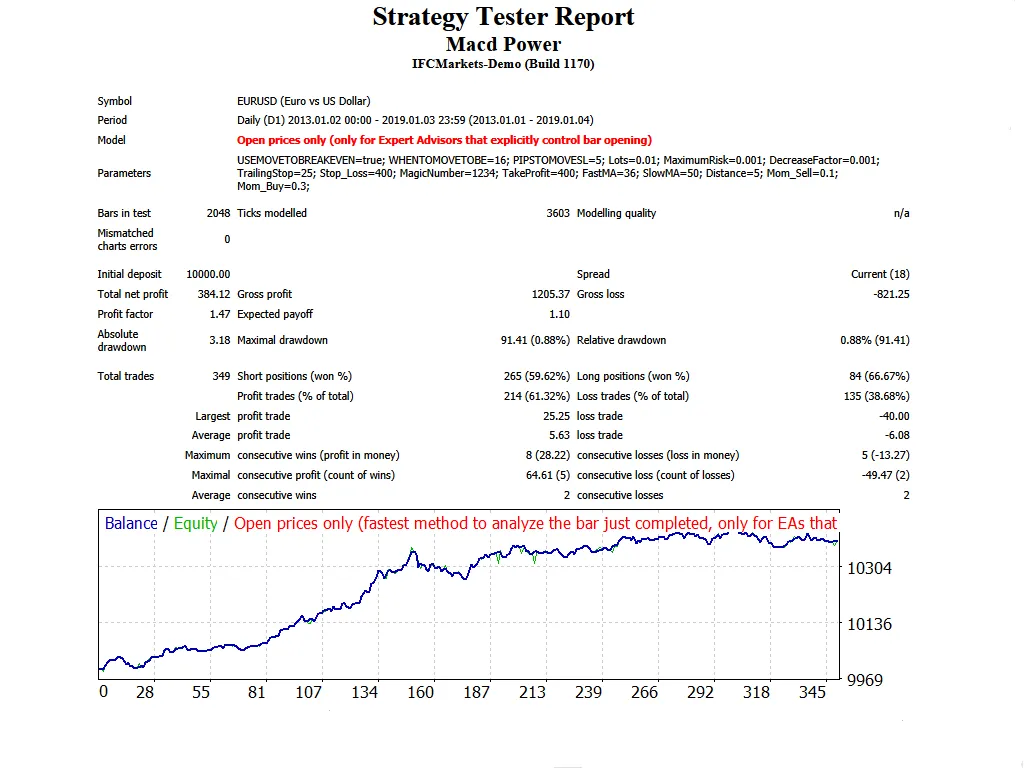
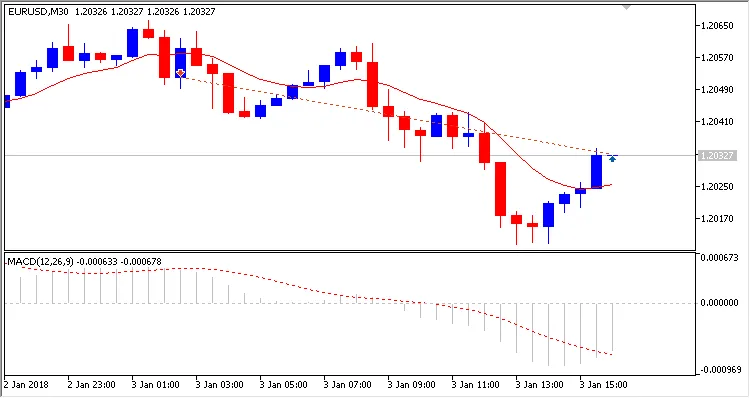
If you’re looking to enhance your trading game, let me introduce you to MACD Power. This nifty Exper...
Hey there, fellow traders! If you’re looking to elevate your trading strategy, let me introduce you ...
Idea by Leonid Basismq5 code author - barabashkakvnThe MACD No Sample Expert Advisor is a powerful t...
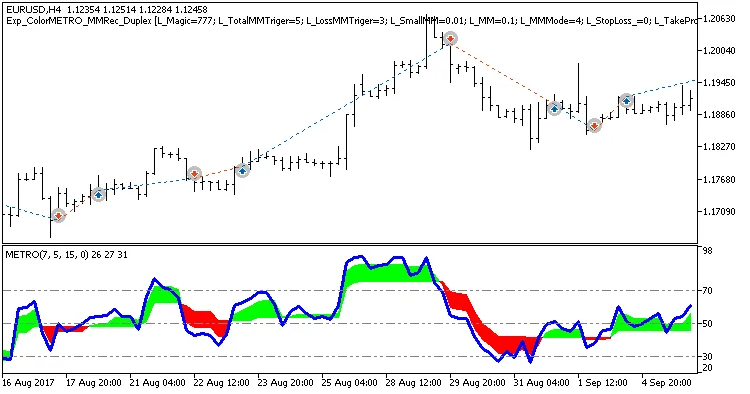
Hey there, fellow traders! Today, we're diving into the Exp_ColorMETRO_MMRec_Duplex, a powerful trad...
Idea by PAMXA Code Author - barabashkakvn This trading strategy leverages signals generated from two...
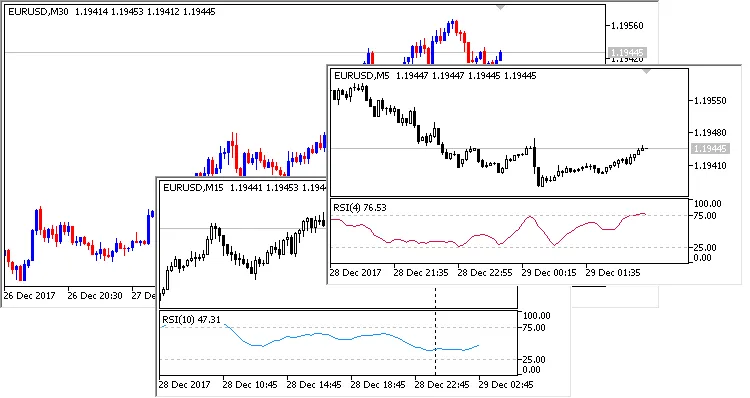
Idea by jirimacmq5 code author - barabashkakvnThe jMaster RSI is an Expert Advisor de...
Hey fellow traders! Today, I'm excited to share an innovative trading tool that can enhance your tra...
If you’re looking to up your trading game, the Yesterday Today EA for MetaTrader 5 might just be you...
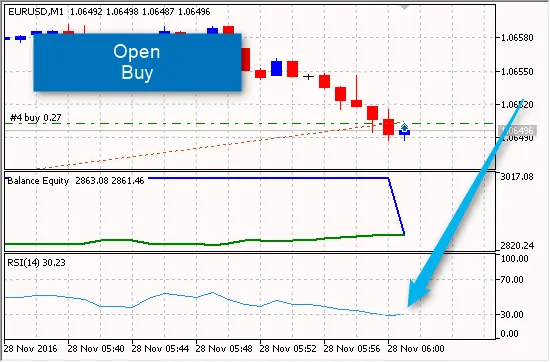
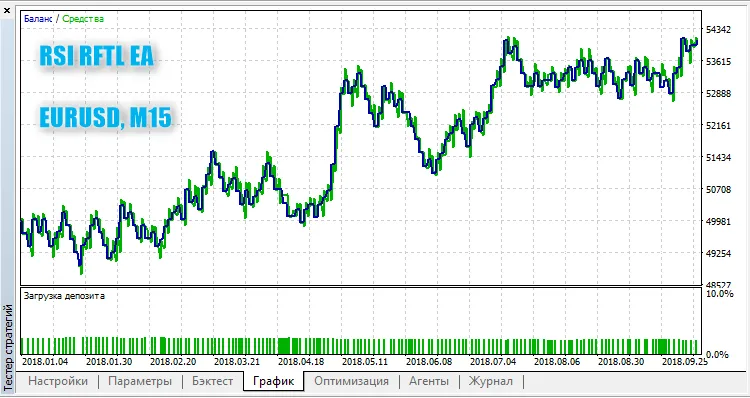
Welcome back, fellow traders! Today, I’m excited to share the latest enhancements to the RSI EA, now...
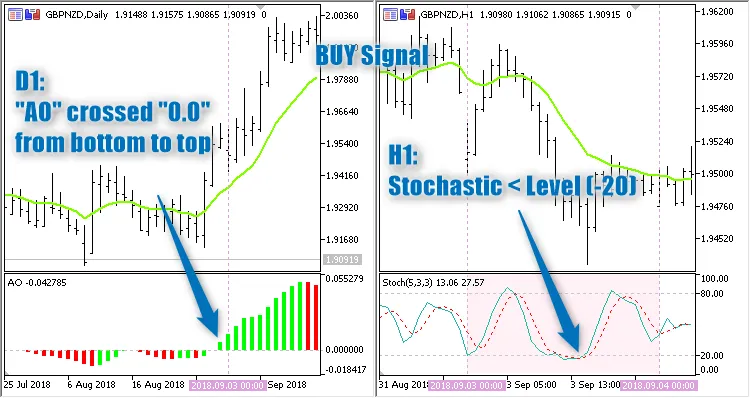
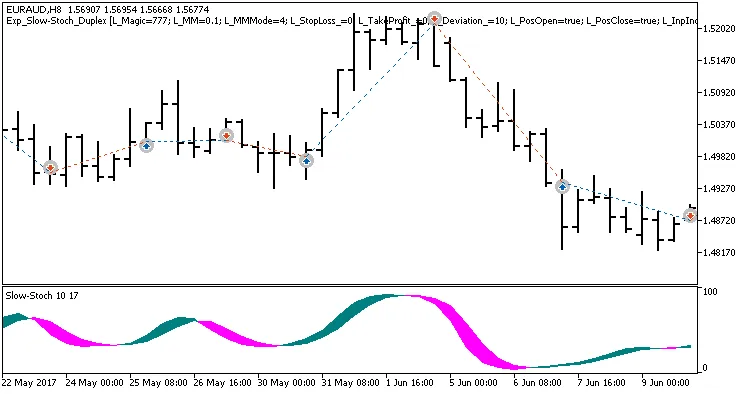
Are you ready to take your trading to the next level? Meet the Exp_Slow-Stoch_Duplex, a powerful sys...
Created by JS_SergeyCode Author - barabashkakvnThis Expert Advisor (EA) leverages a custom indicator...
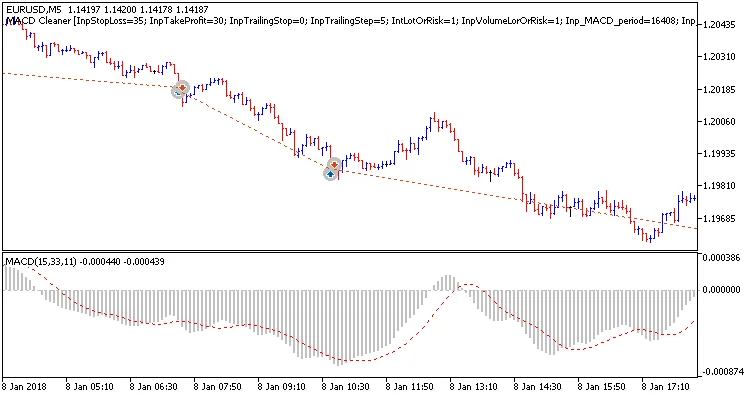
Idea by Artem Titarenkomq5 code author - barabashkakvnThe MACD Cleaner is an Expert A...
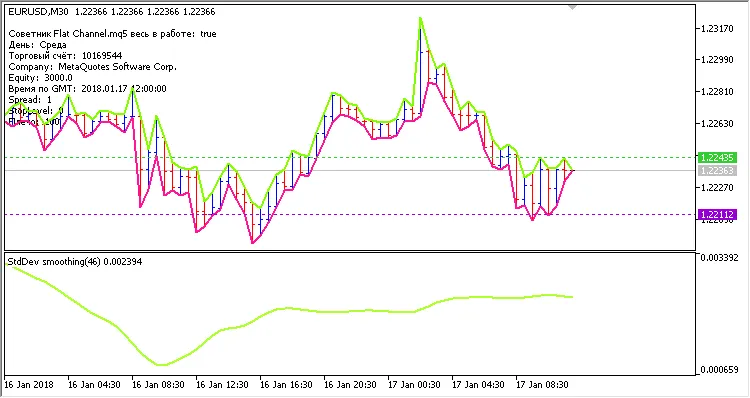
Idea by - bird0mq5 code author - barabashkakvnThis Expert Advisor (EA) employs the iStdDev indicator...
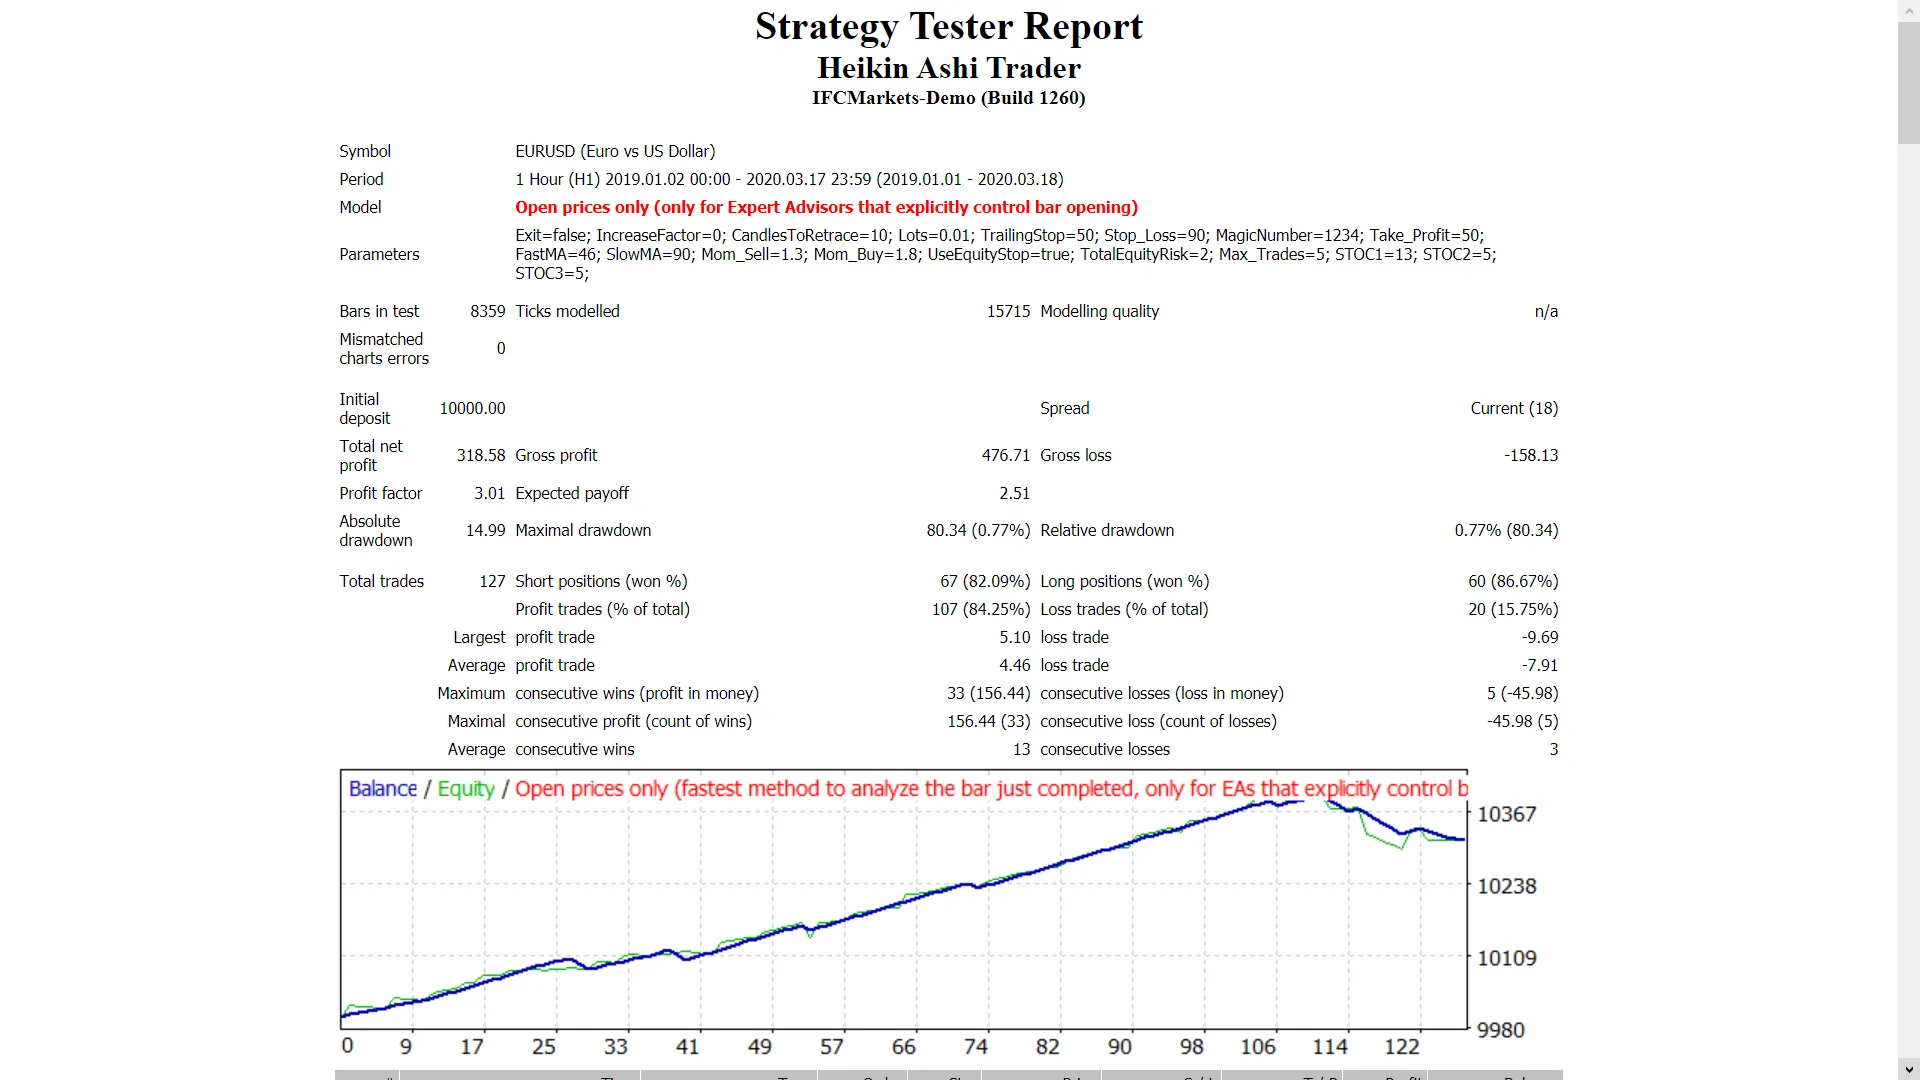
The Heikin Ashi Trader Expert Advisor (EA) utilizes a strategy centered around the Heikin Ashi indic...
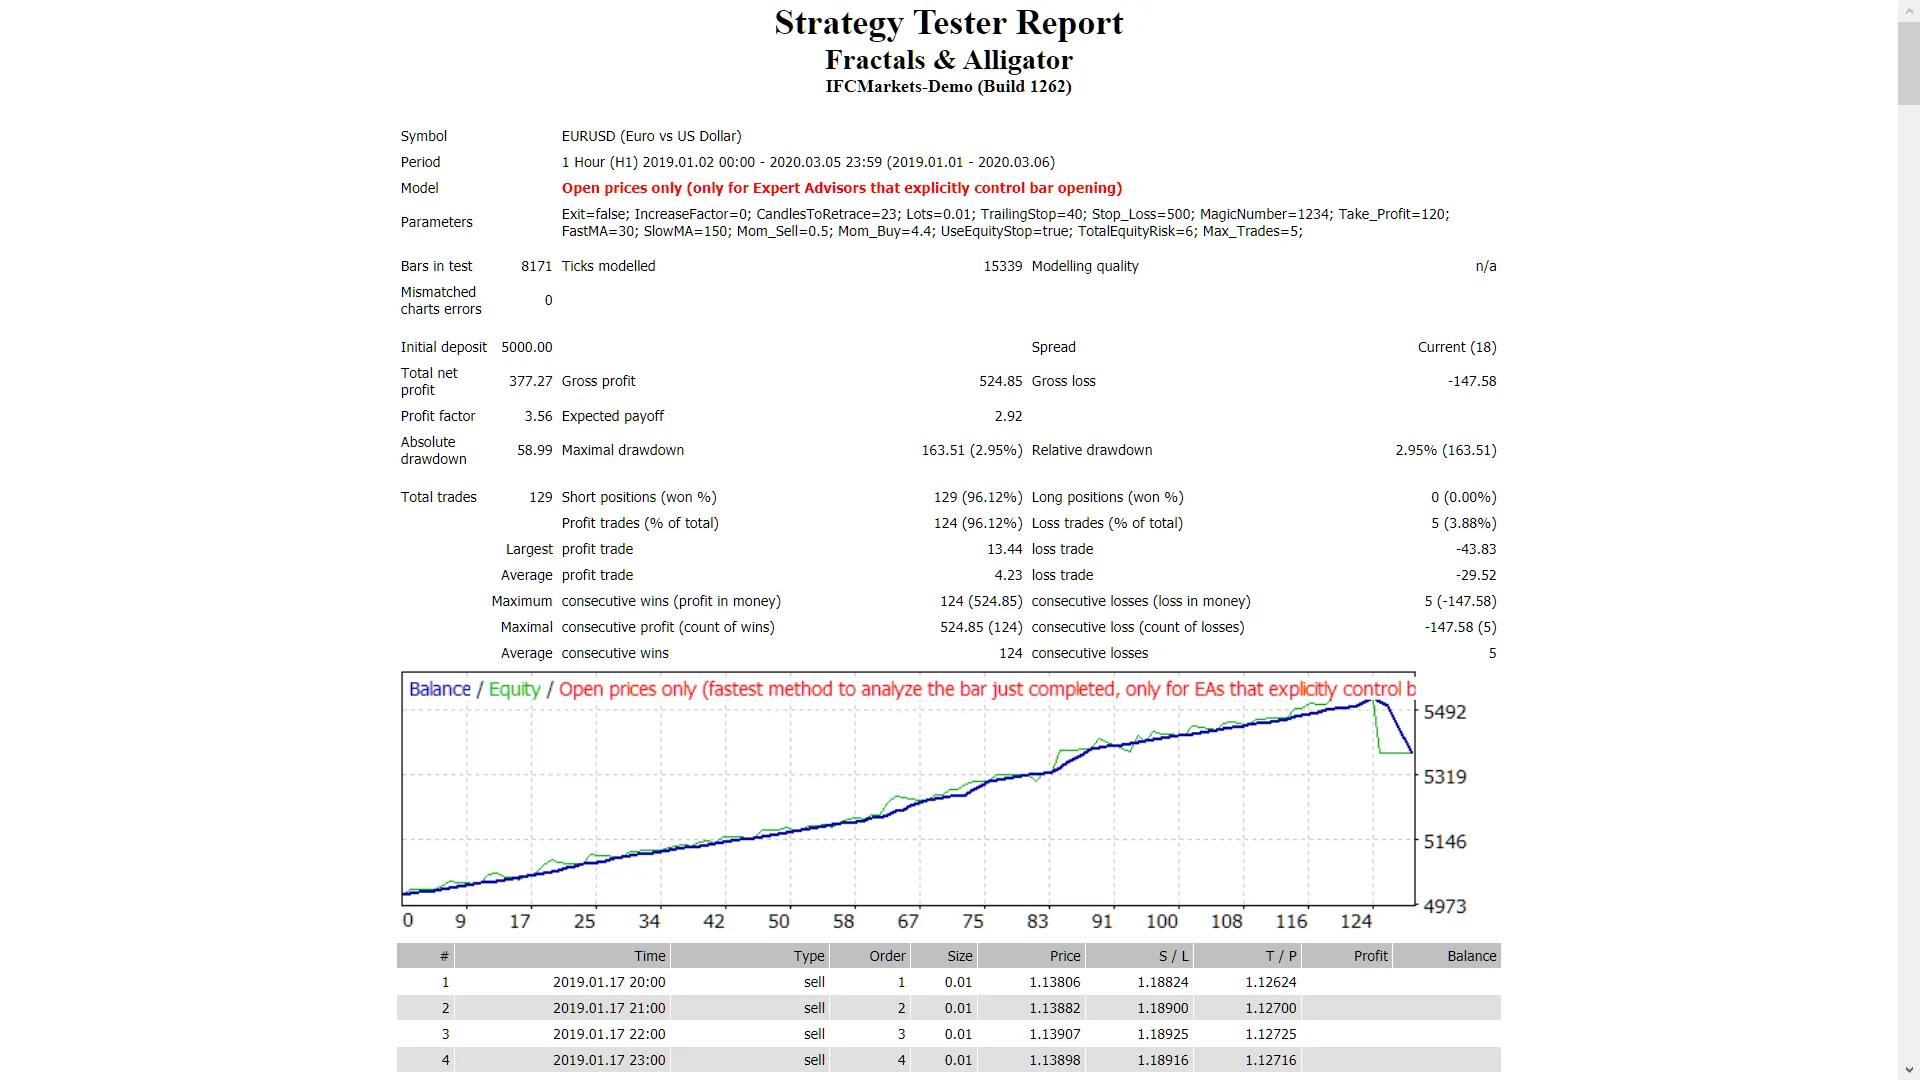
Are you looking to elevate your trading game? The Fractals & Alligator Expert Advisor (EA) is design...
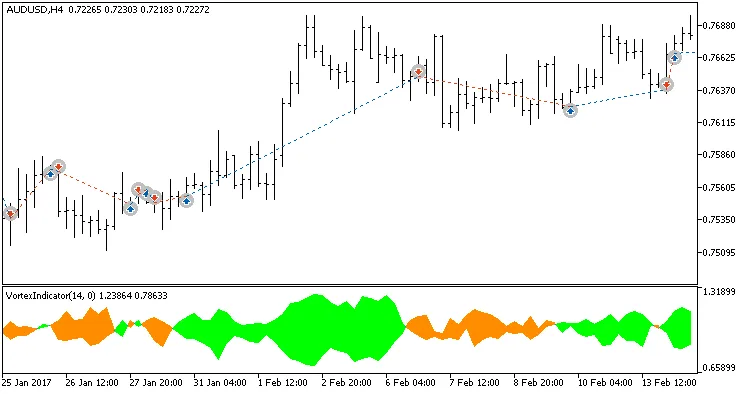
Contributed by: RietsuikerCode by: barabashkakvnThis Expert Advisor (EA) utilizes the iMA (Moving Av...
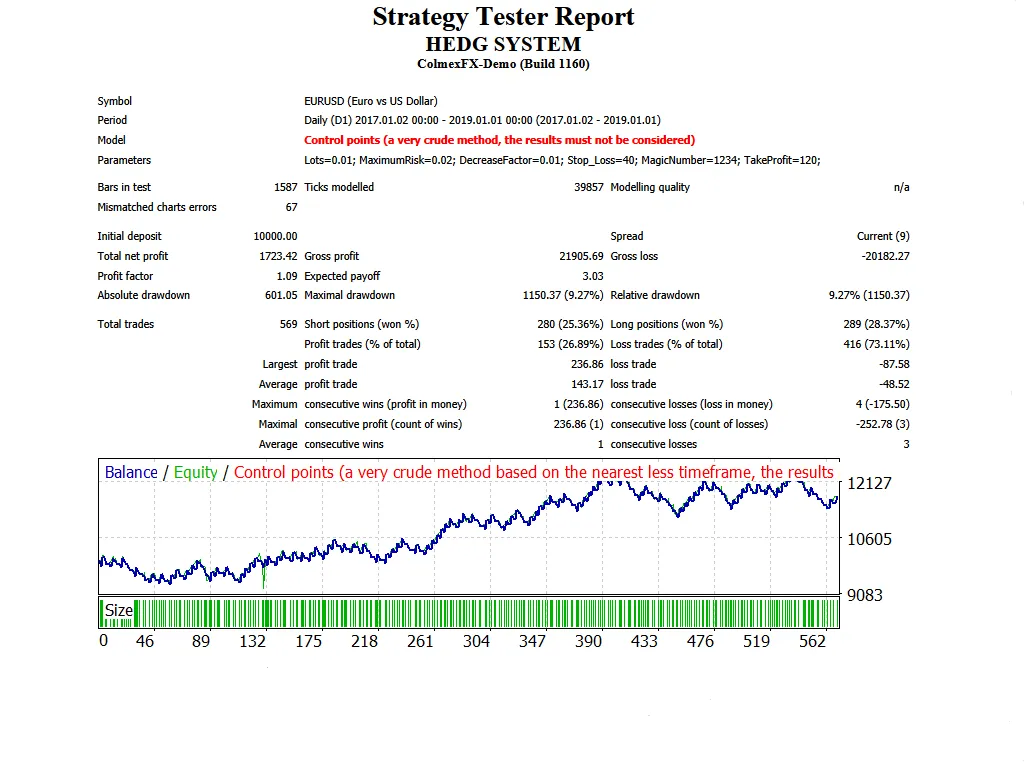
Idea by: ScriptorCode mq5 by: barabashkakvn This EA is designed for hedge accounts ONLY! T...
Idea by: ScriptorCode by: barabashkakvnImportant: This EA is designed for hedge accounts O...
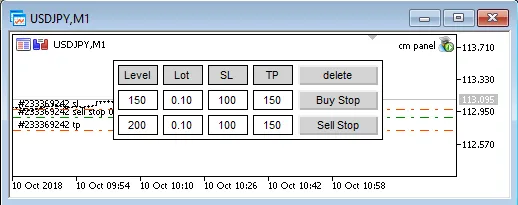
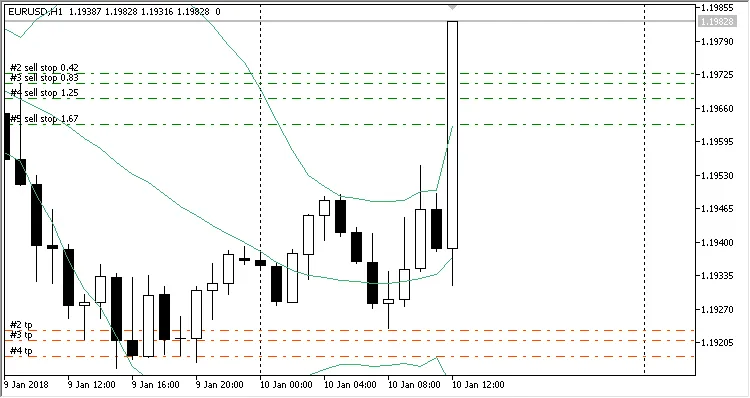
Hey there, fellow traders! If you’re looking to simplify how you manage your stop orders, you’re in ...
Idea by: Marc BoggsCode mq5 by: barabashkakvnImportant: The EA Only Works on Hedge Account...