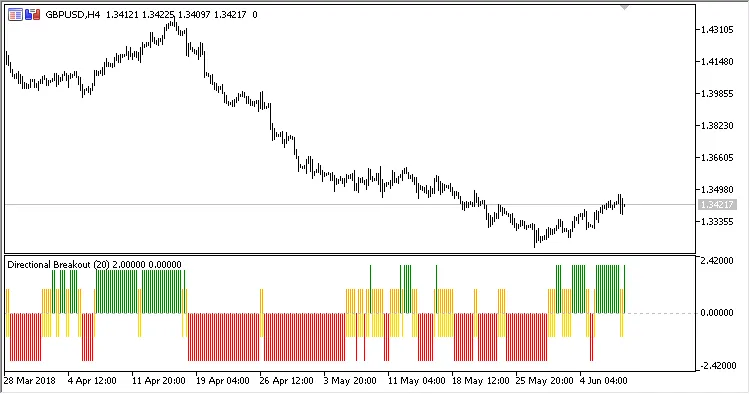
Hey traders! Today, let's dive into the Directional Breakout Indicator for MetaTrader 5. This handy tool gives you insights through a colorful histogram that reflects how candlestick prices stack up against the moving average.
There are three key parameters you can tweak to make this indicator work for you:
- MA Period - This sets the calculation period for the moving average;
- MA Method - Choose your preferred method for calculating the moving average;
- Applied Price - Decide which price you want to use for the calculations.
Calculation:
If Low > MA:
MA > PrevMA = color 1
MA < PrevMA = color 2
If High < MA:
MA < PrevMA = color 3
MA > PrevMA = color 4
Otherwise = color 5
Where:
MA is the moving average based on the Period, Method, and Applied price
PrevMA - moving average from the previous bar
By understanding how this indicator works, you can make more informed trading decisions and potentially boost your trading performance. Happy trading!
Related Posts
- Unlocking MetaCOT 2: Your Ultimate CFTC Indicator Toolkit for MT4
- Hourly Buffers for Data Collection in MetaTrader 5: A Simple Guide
- Visualize Current Trends Across All Time Frames with This MetaTrader 4 Indicator
- Unlocking the Power of Master Tools for MetaTrader 4
- Mastering the Open Range Breakout Indicator for MetaTrader 5