Let’s dive into the world of linear regression lines, particularly how they’re used in MetaTrader 5. This handy tool not only plots the regression line but also adds a standard error channel projection, giving you deeper insights into market trends.
At its core, linear regression is all about understanding the relationship between two variables. Think of it this way: you might want to see how the heights of individuals correlate with their weights. By fitting a straight line to the data points, you can start to visualize this relationship and make informed trading decisions.
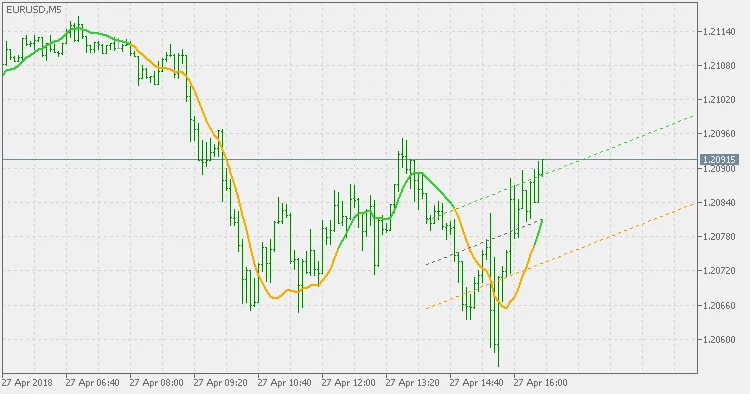
Here are a couple of key points to keep in mind when using linear regression in your trading:
- Line Color Matters: The color of the linear regression line is determined by the slope at each specific point, not just the overall slope of the regression line. This means each point gives you a unique perspective on market behavior.
- Standard Error Channel: The channel you see isn’t a standard linear regression channel. Instead, it’s calculated using standard error, which means you can’t directly compare it to a traditional linear regression channel—except for the middle line.
Integrating linear regression into your trading strategy can help you better understand market movements and enhance your decision-making process. Happy trading!
Related Posts
- Unlocking MetaCOT 2: Your Ultimate CFTC Indicator Toolkit for MT4
- Visualize Current Trends Across All Time Frames with This MetaTrader 4 Indicator
- Unlocking the Power of Master Tools for MetaTrader 4
- Unlock Trading Insights with Volume Profile + Range v6.0 for MetaTrader 5
- Hourly Buffers for Data Collection in MetaTrader 5: A Simple Guide