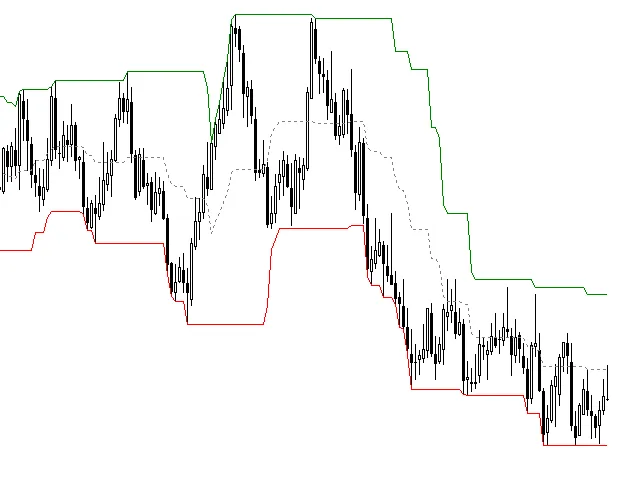
안녕하세요, 트레이더 여러분! 오늘은 돈치안 채널(Donchian Channel)이라는 유용한 지표에 대해 이야기해보려고 해요. 이 지표는 가격의 변동성을 분석하고 매매 신호를 제...
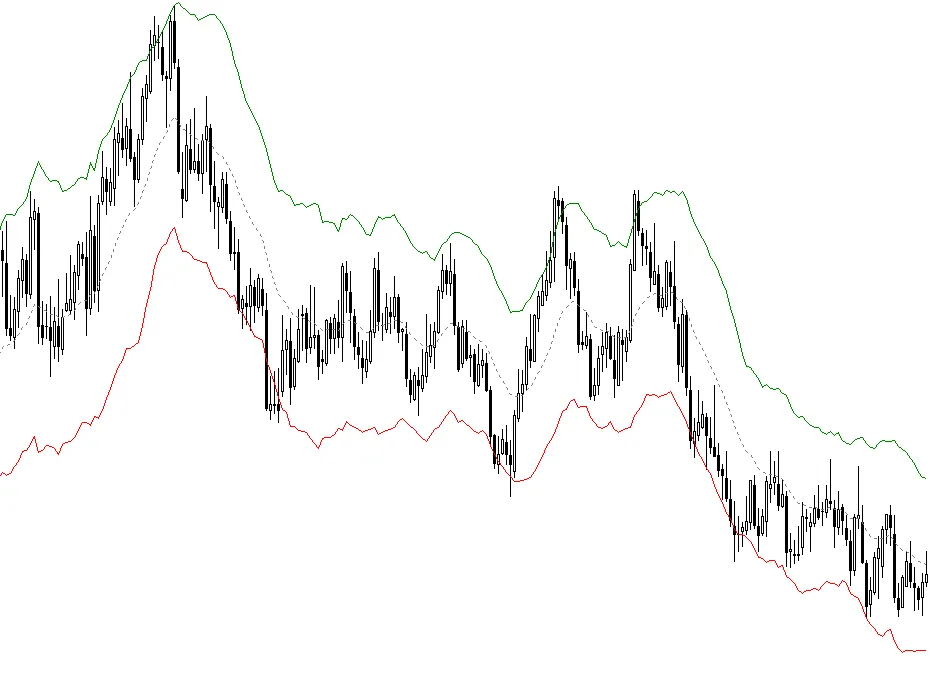
안녕하세요, 트레이더 여러분! 오늘은 메타트레이더 5에서 사용할 수 있는 켈트너 채널(Keltner Channel)에 대해 이야기해볼게요. 이 지표는 초보자에게 매우 유용한 도구로...
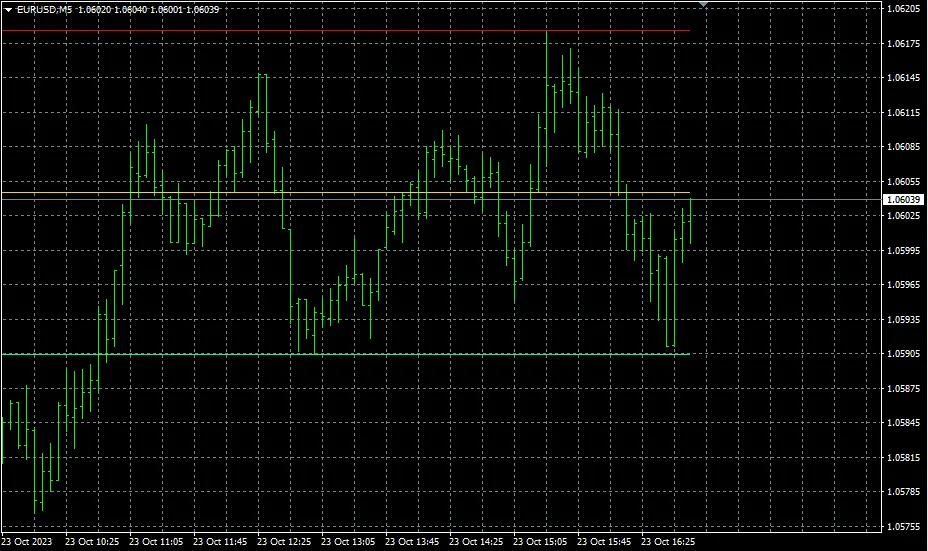
안녕하세요, 트레이더 여러분! 오늘은 지지와 저항을 활용하고자 하는 분들을 위해 아주 간단한 코드 예제를 소개해드릴게요. 이 코드는 지지와 저항 값을 기반으로 계산된 중간선을 포함...
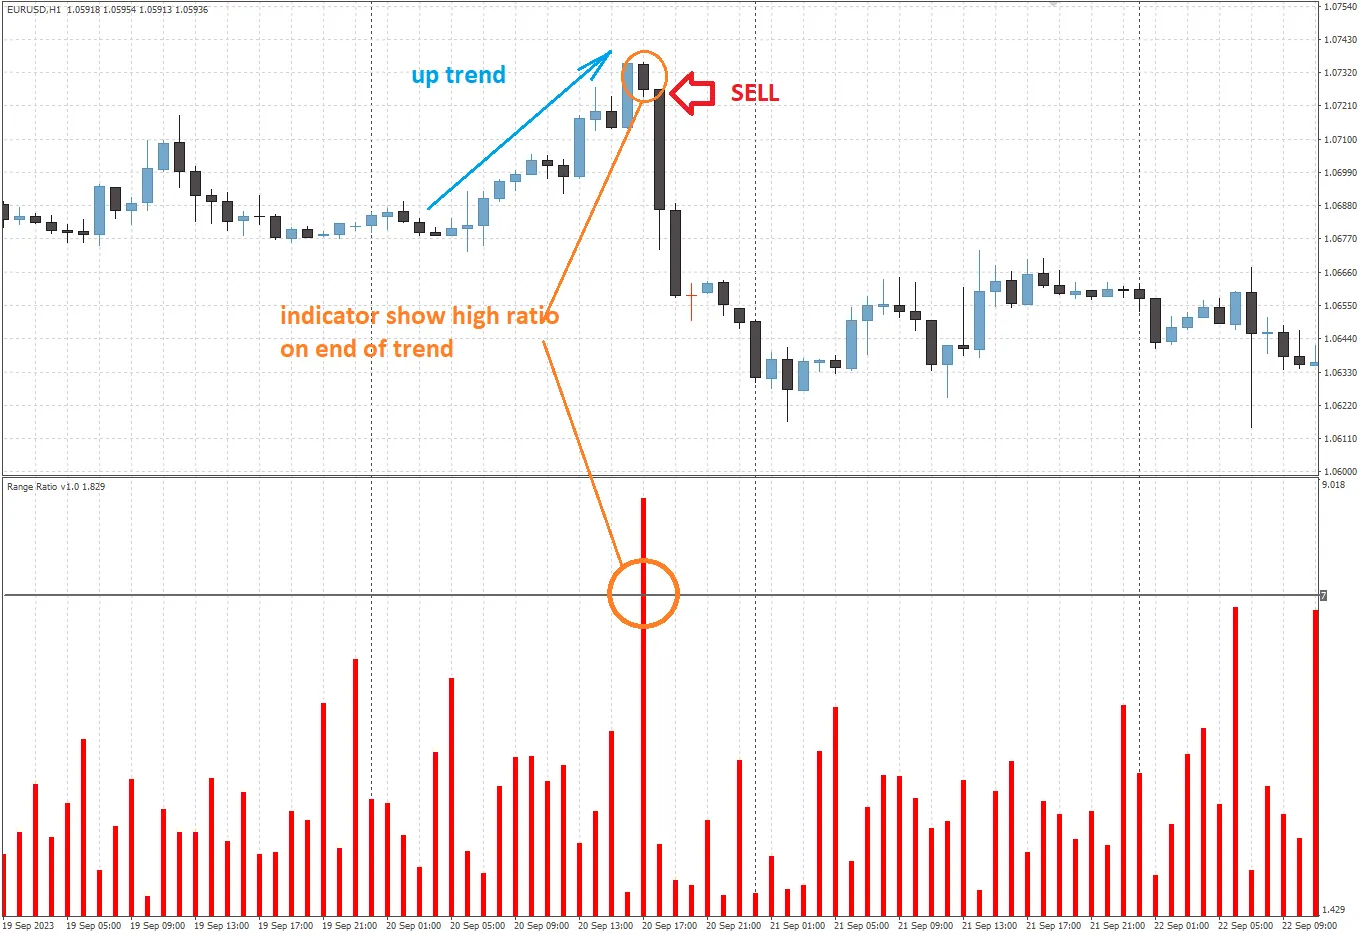
차트 분석을 한층 더 발전시키는 유용한 방법, 바로 레인지 비율 지표입니다. 이 지표는 각 바의 내부 움직임 크기와 현재 바의 크기 비율을 보여줍니다. 신호 확인에 아주 좋은 도구...
안녕하세요, 트레이더 여러분! 오늘은 메타트레이더 5에서 CCI 지표에 시프트 파라미터를 추가하는 방법에 대해 이야기해보려고 해요. 이 코드는 iCCI 함수를 활용하여 CCI 지표...
스크린샷 보기 M4HA는 적응형 HMA와 그 스무딩 라인의 교차를 기반으로 한 트렌드 지표입니다. 이 지표를 사용하면 트렌드의 시작을 조기에 파악할 수 있습니다. 특히 플랫 지표와...
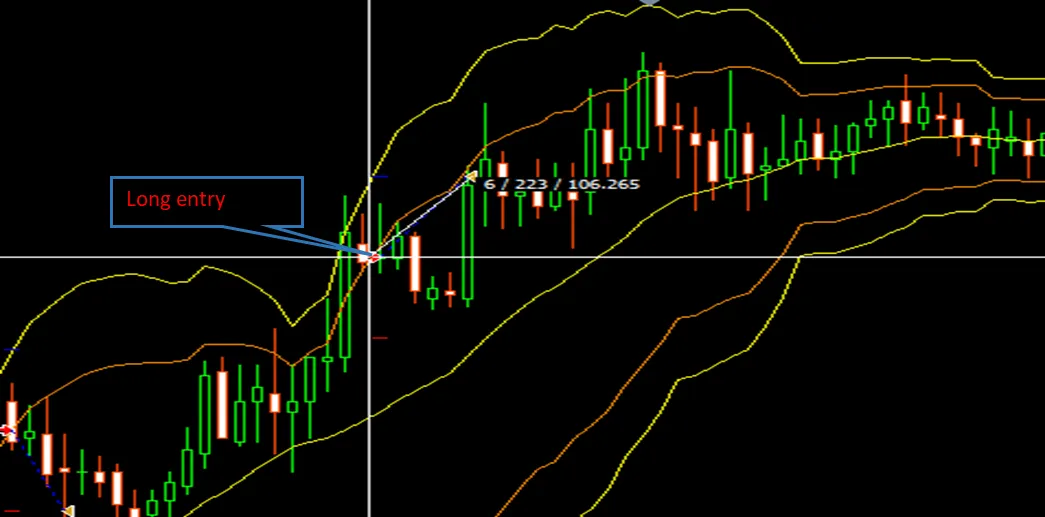
1. 개요 더블 볼린저 밴드 전략은 외환 시장에서 진입과 퇴장을 필터링하기 위해 두 개의 볼린저 밴드를 활용합니다. 이 전략은 가격이 3σ(2 표준편차) 위로 교차할 때 매수(매도...
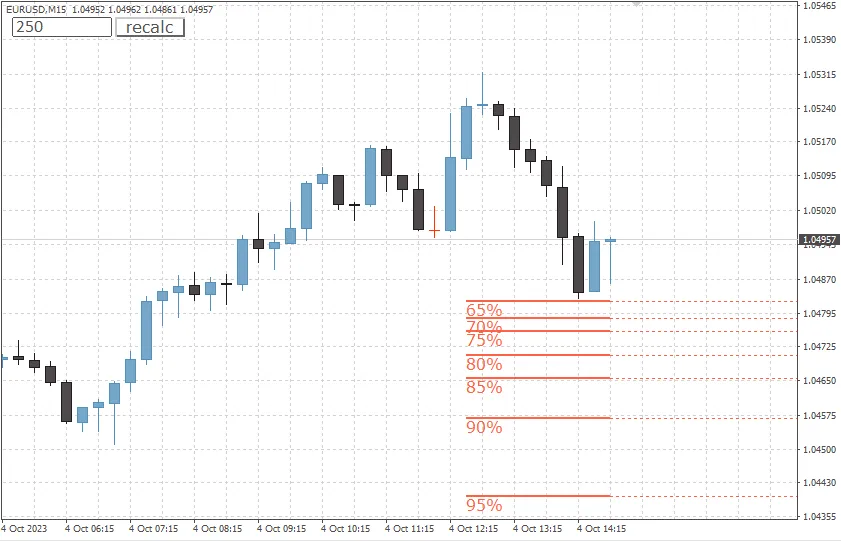
안녕하세요, 트레이더 여러분! 오늘은 메타트레이더 4에서 사용할 수 있는 유용한 도구인 가격 반등 계산기에 대해 이야기해볼까 합니다. 이 지표는 최대 롤백 크기를 설정하면, 차트의...
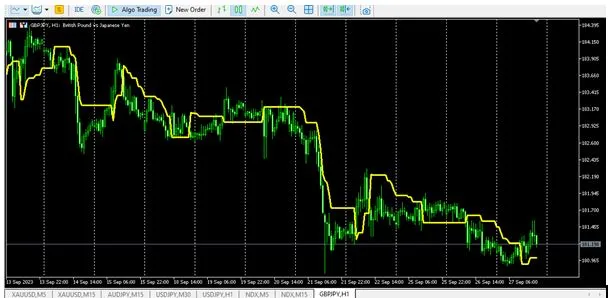
안녕하세요, 트레이더 여러분! 오늘은 MetaTrader 5에서 사용할 수 있는 ATR 트레일링 스탑에 대해 이야기해볼게요. 이 지표는 Mod_ATR_Trailing_Stop라는 ...
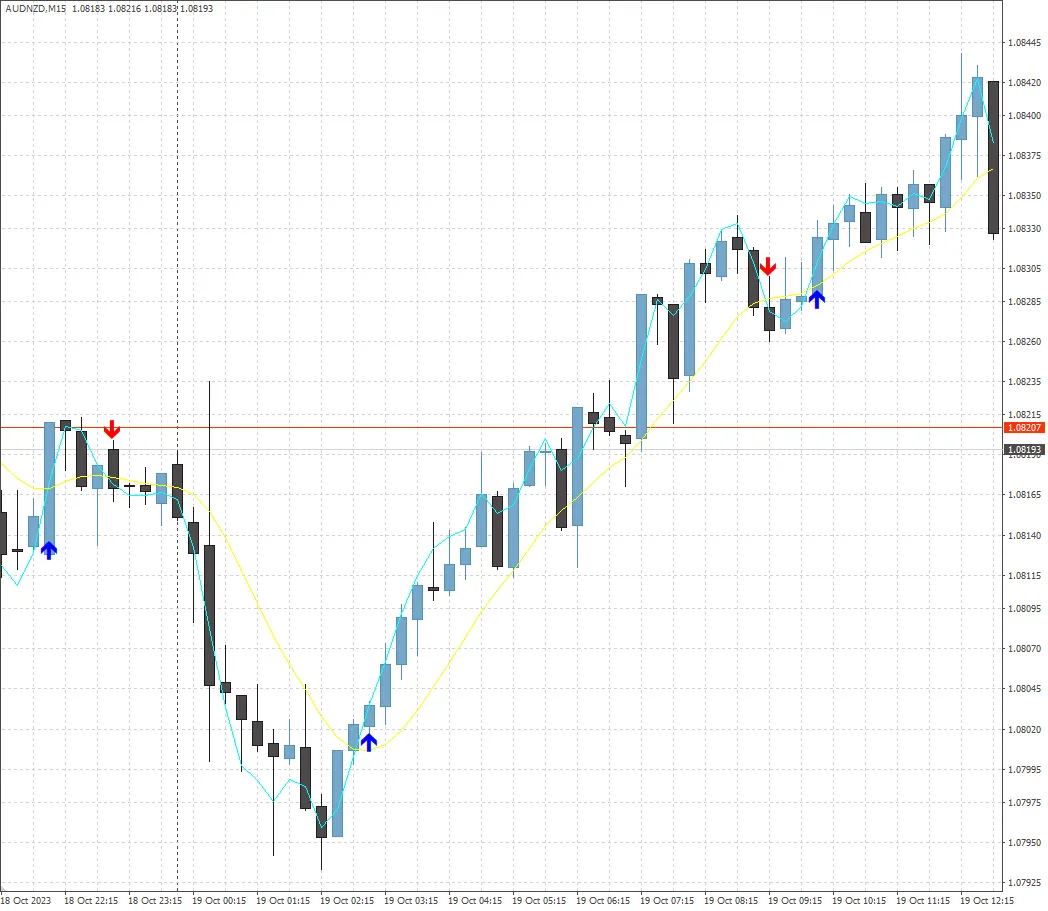
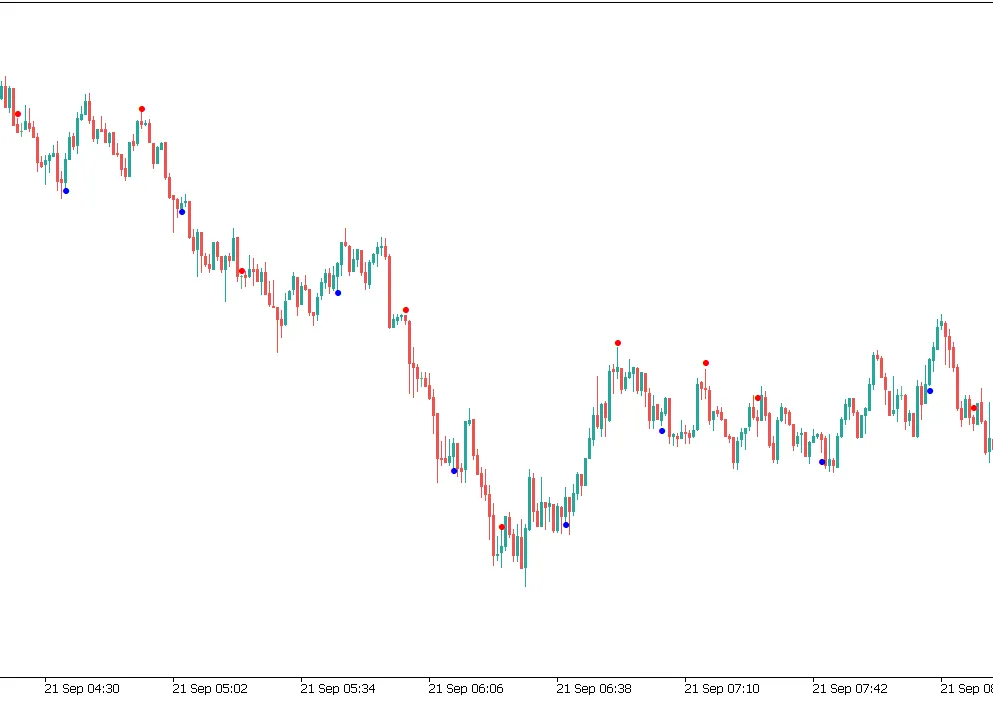
트렌드 예측기는 가격 채널 분석과 변동성 특성을 바탕으로 트렌드 변화를 예측하는 강력한 도구입니다. 이 지표는 화살표 형태로 정확한 신호를 제공하여 트레이더가 트렌드 반전의 순간을...
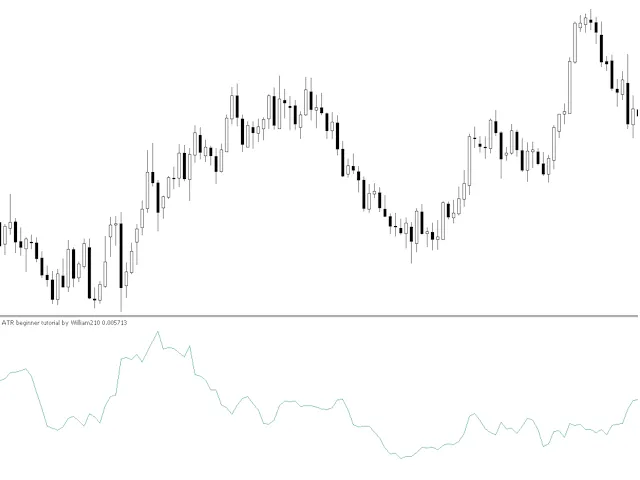
안녕하세요, 트레이더 여러분! 오늘은 ATR(평균 진폭)에 대해 알아보려고 합니다. ATR은 시장의 변동성을 측정하는 유용한 지표로, 많은 트레이더들이 활용하고 있죠. 초보자분들도...
안녕하세요, 트레이더 여러분! 오늘은 초보자분들을 위해 Awesome Oscillator(이하 AO)에 대해 이야기해보려 합니다. AO는 시장의 추세를 분석하는 데 유용한 지표로,...
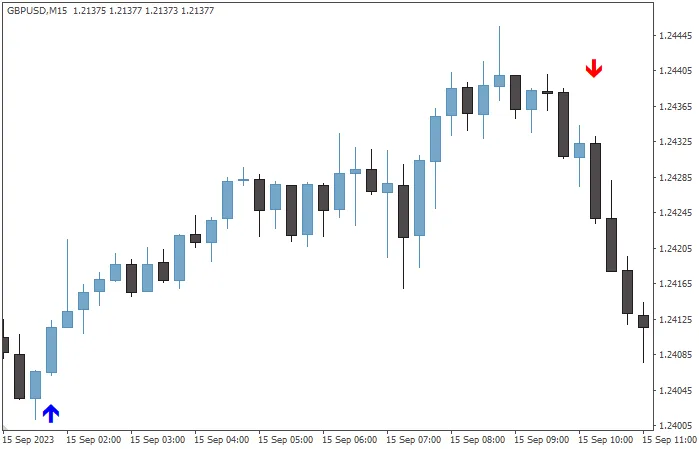
안녕하세요, 트레이더 여러분! 오늘은 일본어에서 유래된 '마루보주'에 대해 알아보려고 합니다. 마루보주는 그림자가 없는 긴 몸체를 가진 캔들스틱으로, 실제로 매매에서 매우 유용하게...
안녕하세요, 트레이더 여러분! 오늘은 적응형 이동 평균(AMA)에 대해 알아보려고 합니다. 이 지표는 특히 변동성이 큰 시장에서 유용한 도구로, 여러분의 거래 전략에 큰 도움이 될...
안녕하세요, 트레이더 여러분! 오늘은 메타트레이더 5에서 사용 가능한 올리게이터 지표에 대해 이야기해 보려고 해요. 이 지표는 가격 움직임을 이해하고, 매매 타이밍을 잡는 데 큰 ...
안녕하세요, 트레이더 여러분! 오늘은 초보자도 쉽게 사용할 수 있는 RSI(상대강도지수)에 대해 이야기해보려고 해요. 특히, Irsi() 코드 없이 RSI를 활용하는 방법을 소개할...
안녕하세요, 트레이더 여러분! 오늘은 MetaTrader 5에서 사용할 수 있는 프랙탈 지표에 대해 이야기해볼게요. 많은 분들이 잘 아시는 이 지표는 기본적인 형태에서 벗어난 조정...
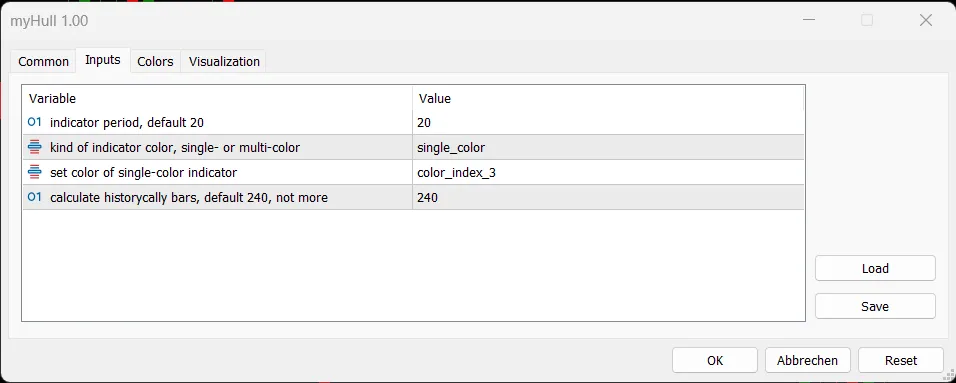
안녕하세요, 트레이더 여러분! 오늘은 메타트레이더 5에서 사용할 수 있는 헐 이동 평균(Hull Moving Average, HMA) 지표에 대해 알아보려고 합니다. 이 지표는 가...
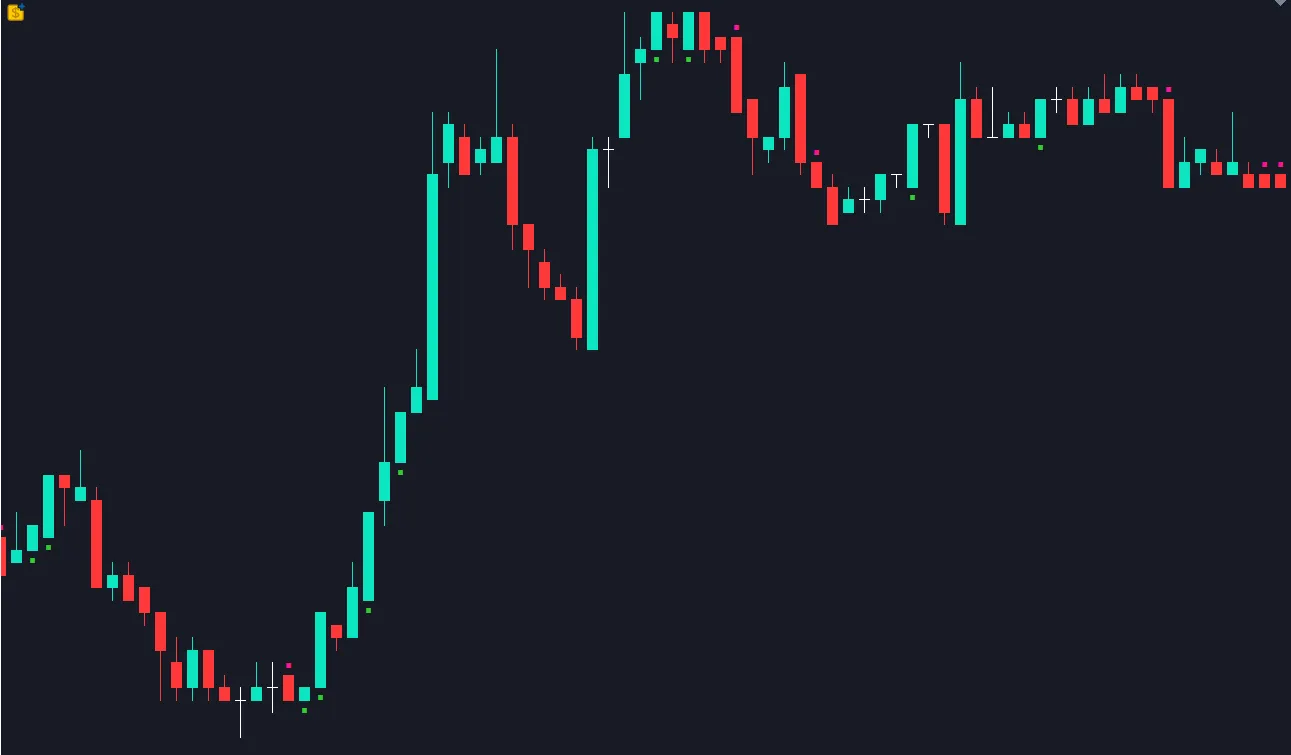
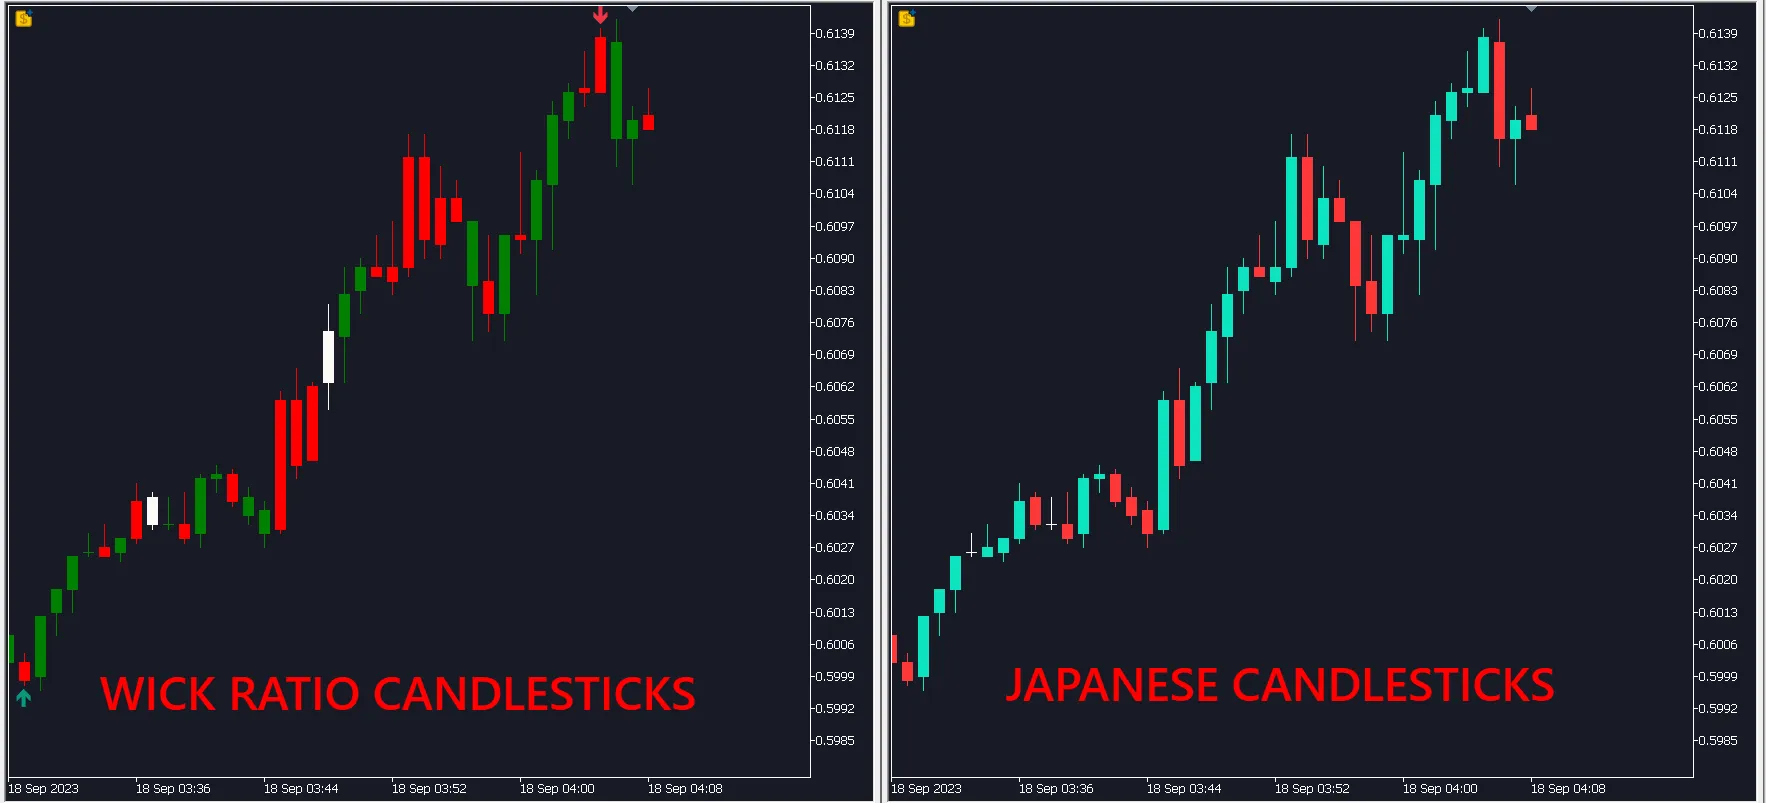
안녕하세요, 트레이더 여러분! 오늘은 메타트레이더 5에서 사용할 수 있는 윅 비율 캔들스틱에 대해 이야기해볼게요. 이 지표는 일반적인 시가와 종가 대신, 상단과 하단 윅의 비율로 ...
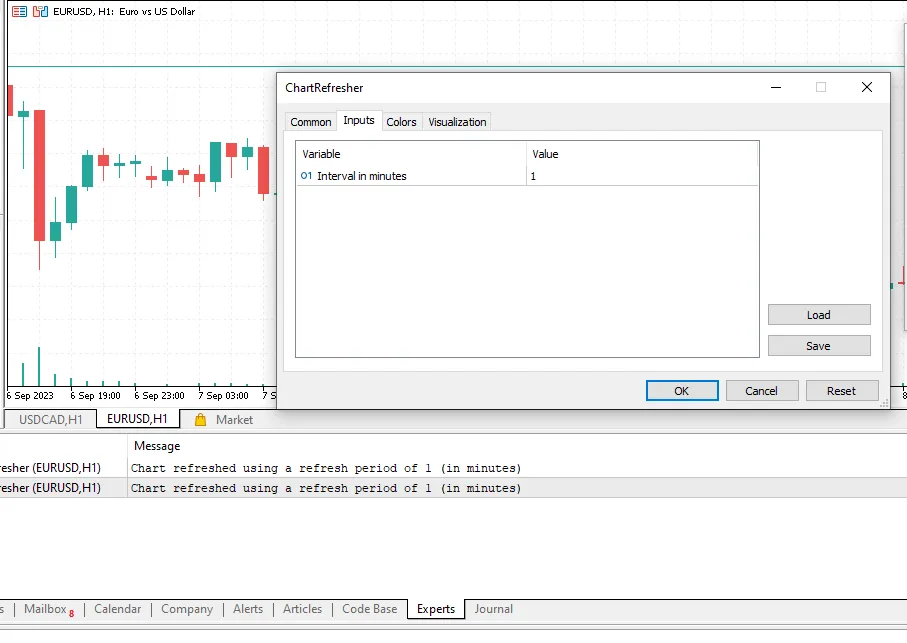
안녕하세요, 트레이더 여러분! 오늘은 메타트레이더 5(MT5)에서 유용하게 사용할 수 있는 자동 차트 새로 고침기라는 인디케이터에 대해 이야기해볼까 합니다. 가끔 인디케이터가 버그...