If you're trading on hourly timeframes, you'll want to check out this fantastic indicator for quadrangle patterns. It’s designed specifically for MetaTrader 4 and can really sharpen your trading strategy.
This indicator highlights key quadrangle figures, including:
- Daily Open
- Daily High
- Daily Close
- Daily Low
The core idea behind this system is to visually gauge the next market movement:
- If the latest figure is narrowing and the narrowing is smaller than the base of the figure, it suggests a continuation of the trend (at least equal to the base size).
- If the latest figure is expanding and the expansion is larger than the base of the figure, it indicates a potential reversal (again, at least equal to the base size).
- If the base and the end of the figure appear visually equal, expect a correction.
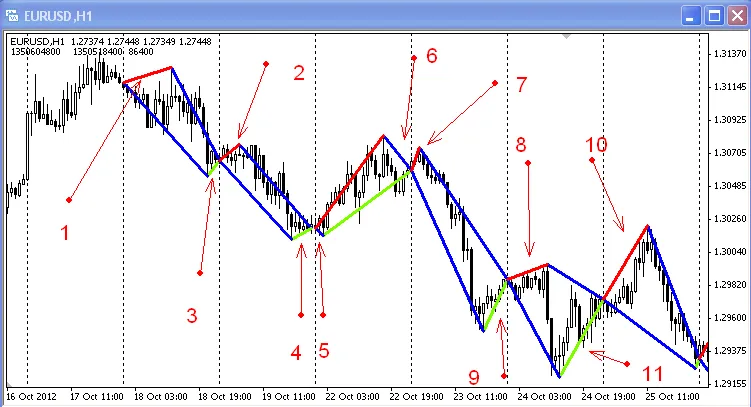
- Narrowing 3 is smaller than base 1 == trend continuation is expected.
- Narrowing 4 is roughly equal to base 2 == a flat market is on the horizon.
- Narrowing 6 is larger than base 5 == a trend change is likely.
- Narrowing 9 is larger than base 7 == a trend change is likely.
- Narrowing 11 is larger than base 8 == a trend change is likely.


Comments 0