Candle Size Indicator Overview
Main Features of the Indicator
Candle Size Calculation:
- This indicator measures the range of candles (the difference between high and low) and displays it in points or pips for easy reference.
- Bullish and bearish candles are color-coded, making it a breeze to interpret the market at a glance.
Customization by Day of the Week:
- Choose to analyze candles from specific days (like Monday or Tuesday) or include every day.
- Each day of the week is assigned a unique color, allowing you to spot daily trends with ease.
Dynamic Text Positioning:
- Text can be adjusted vertically to avoid overlapping with other chart elements.
- The indicator automatically shifts the text to stay within the visible area of the chart.
Style and Formatting:
- Personalize the font, size, color, and anchor type of the text displayed on your chart.
- Choose from various line styles (like dashed or dotted) for enhanced visualization.
Automatic Cleanup:
- When you remove the indicator from the chart, all associated objects are cleared automatically, keeping your chart tidy.
External Variables Explained
Here's a breakdown of the user-configurable external variables:
InpAmount | Number of candles to analyze. |
InpMCConfigOptimistic | Optimistic calculation type (like maximum). |
InpMCConfigPessimistic | Pessimistic calculation type (like minimum). |
InpMCCorOptimistic | Color for bullish candles. |
InpMCCorPessimistic | Color for bearish candles. |
InpMCConfigFountain | Font for the text displayed on the chart. |
Sunday, Monday, etc. | Specific colors for each day of the week. |
InpStyle | Line style (like dashed or dotted). |
InpWidth | Line width. |
textplace | Distance of the text from the top of the graph. |
InpFont | Font of the text displayed in the graph. |
InpFontSize | Font size. |
InpAnchor | Type of anchor for the text (like top, bottom, center). |
Best Instruments and Timeframes for Use
- Instruments: This indicator can be applied to any financial instrument on the MetaTrader 5 platform, including currency pairs, indices, commodities, and cryptocurrencies.
- Timeframes: Compatible with all timeframes, from 1-minute to weekly charts. However, larger timeframes (like H1 or D1) tend to provide clearer and more accurate volatility analysis.
How to Interpret the Indicator
Candle Size:
- A larger candle indicates higher volatility during that period.
- A smaller candle suggests reduced activity or market consolidation.
Colors:
- Bullish candles are shown in a specific color (like gold).
- Bearish candles are displayed in another color (like grey).
Days of the Week:
- Using different colors for each day helps you identify patterns in price behavior on specific days.
Practical Use Cases
- Volatility Analysis: This tool helps traders pinpoint days or periods with elevated volatility based on candle size.
- Daily Patterns: Analyzing candles from specific days allows you to recognize trends in price behavior.
- Decision Making: Quick visual insights into bullish and bearish strength aid in making informed trading choices.
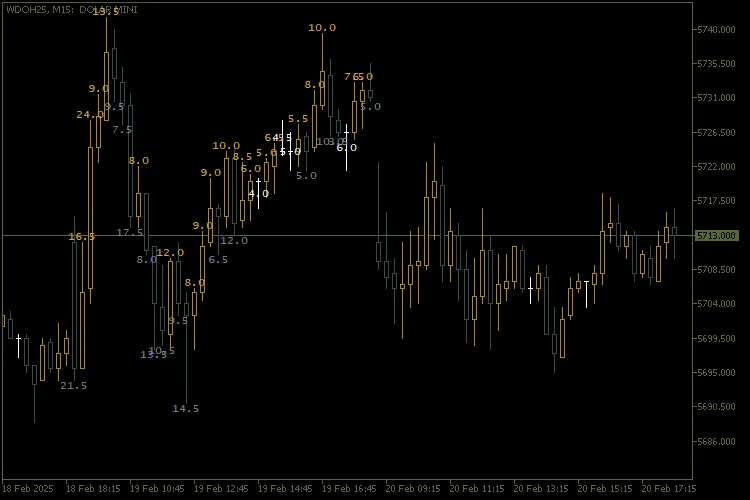
Visual Example
Figure 1: Example chart featuring the indicator. Colors differentiate between bullish and bearish candles, while text displays each candle's size.
https://www.mql5.com/en/charts/20733290/wdoh25-m15-banco-btg-pactual


Comments 0