What Are Quantiles?
In the world of statistics and probability, quantiles are essentially markers that split a data set into equal intervals, allowing traders to analyze market behavior more effectively. Think of them as dividing lines that help us make sense of price movements. Each quantile gives us a cut point, which helps us break down our data into manageable chunks. For example, quartiles split the data into four equal parts using three cut points.
When we talk about q-quantiles, we're referring to values that split our data into q groups of nearly equal size. For instance, if we're dealing with quartiles, we have three quantiles that break our dataset into four parts. This concept can be applied to both discrete and continuous data, providing a comprehensive view of market trends.
How Do Quantile Bands Work?
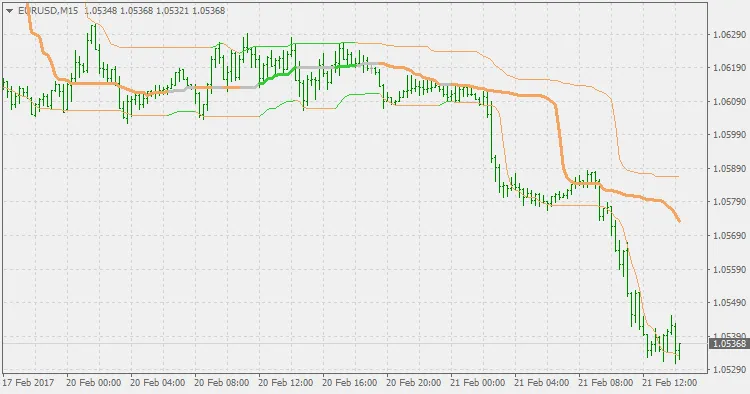
Now, let's get into the nitty-gritty of how the quantile bands indicator operates. The middle line of the indicator isn’t just a simple average; it’s more nuanced. It’s derived from the combination of the two outer quantiles. When both outer quantiles are trending in the same direction, the middle quantile adopts that color. If they’re not aligned, the middle quantile is marked as “undetermined,” typically shown in grey by default.
Why Use Quantile Bands?
- Market Trends: They help identify market trends with clarity.
- Risk Management: Quantile bands can aid in setting stop-loss levels and entry points.
- Visual Appeal: They provide a clear visual representation of price action.
In summary, understanding and utilizing quantile bands can give you an edge in your trading strategy. Whether you’re a seasoned pro or just starting out, this indicator can provide valuable insights into market dynamics.


Comments 0