 Understanding RSI Bands on Your Price Charts
Hey fellow traders! Today, let's dive into an essential tool that can elevate your trading game: the RSI bands rendered directly on your price charts in MetaTrader 4. This handy feature not only helps you visualize critical RSI levels but also makes it easier to make informed trading decisions.
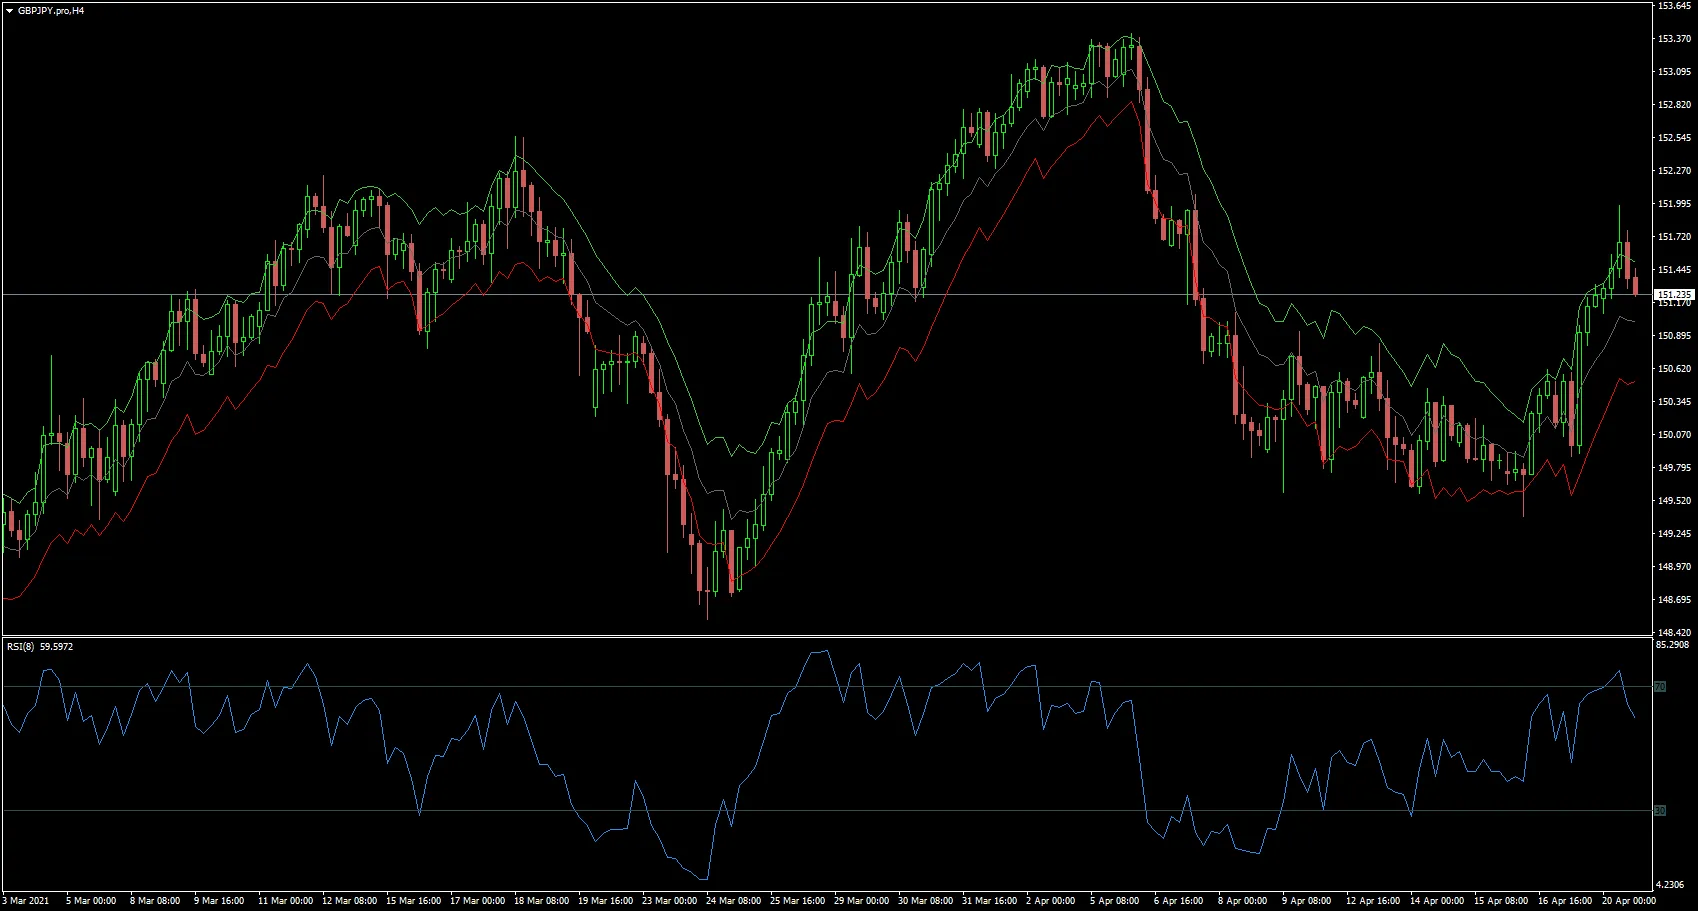
The RSI (Relative Strength Index) is a popular momentum indicator, and its levels are often used to identify overbought and oversold conditions. Here’s how the levels are typically represented:
- RSI 70 Level: This is marked in green, indicating an overbought condition.
- RSI 50 Level: Shown in gray, this is considered the neutral zone.
- RSI 30 Level: This level is highlighted in red, signifying an oversold condition.
Don’t forget, you can adjust these levels to fit your trading strategy using the Level_Adjust feature. Being able to customize your RSI settings allows you to tailor the indicator to your unique trading style and market conditions.
Incorporating these bands into your price charts can help you spot potential entry and exit points more effectively. Happy trading!


Comments 0