If you’re looking to up your trading game, the RSI Bollinger Bands EA might just be what you need. This nifty tool leverages the overbought (OB) and oversold (OS) zones within the RSI framework to generate both long and short trading signals. It’s tailored for M15, H1, and H4 time frames, with the EURUSD M15 chart as the primary execution platform.
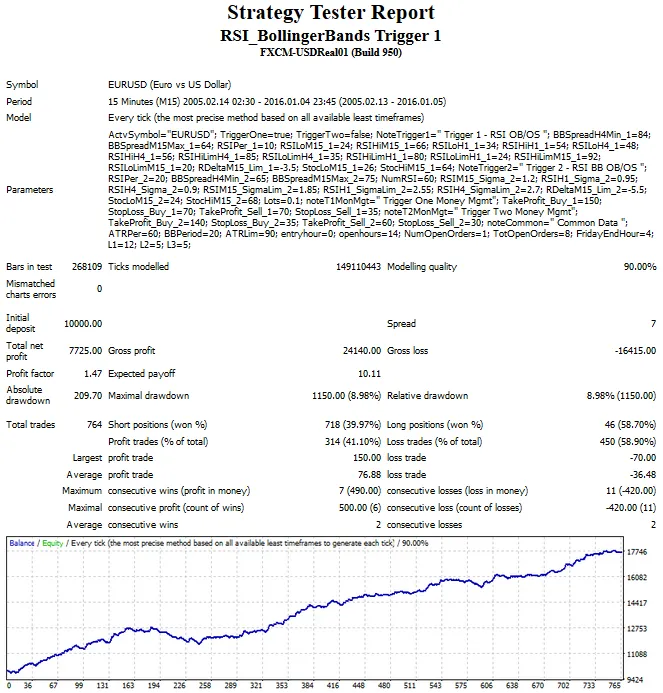
This EA features two distinct triggers that compare different OB/OS methodologies. Trigger 1 sticks to the traditional approach, using fixed RSI values of 70 for overbought and 30 for oversold conditions. It’s a straightforward way to set your parameters and get started.
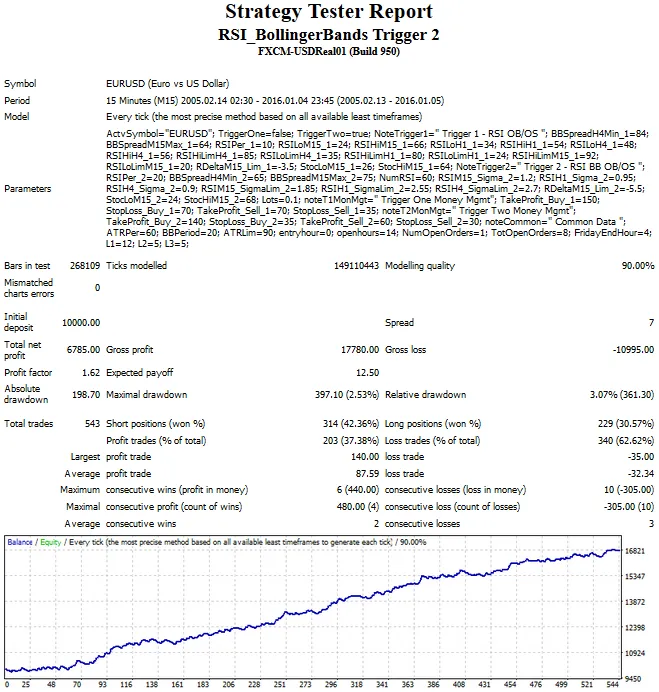
On the flip side, Trigger 2 utilizes RSI Bollinger Bands, which are created around an average RSI over a specified time frame. Here, the OB and OS zones are determined by standard deviations from that average RSI. For instance, an overbought signal is indicated when the RSI value exceeds a computed threshold, defined as RSI_Upper = RSI_Sigma * StdDev + RSI_Avg. In this equation, RSI_Sigma is an external parameter, while StdDev is derived from the RSI distribution of previous bars.
Looking at the Strategy Tester reports, it’s clear that the RSI Bollinger Band method (Trigger 2) excels over an impressive eleven-year span, even outpacing Trigger 1 in terms of performance. Plus, it boasts fewer external variables, delivering a consistent performance across the entire eleven years of 15-minute data.
Tester Reports
Date Test Range: February 2005 - January 2016 for both Trigger 1 and Trigger 2.
Conclusions:
By integrating the Bollinger Band approach with oscillator indicators, you can potentially enhance the performance of your Expert Advisors over extended testing periods. This not only boosts your confidence but may also improve your trading results in the long run.


Comments 0