Hey fellow traders! Today, I want to share some insights on creating an Expert Advisor (EA) for MetaTrader 4 that can help enhance your trading strategy. I was inspired to dive into this after experimenting with grid trading, and I think you'll find it quite valuable.
So, let’s break it down step-by-step. First, we need to analyze N+M bars from the historical data. The idea is to write down the indicator signals for N bars and then calculate the results for M bars.
This will generate a file named [sequence of indicator signals from N bars].csv. This file contains the outcome of the historical data analysis.
Here’s a Quick Example:
Let’s take a look at a simple code block:
      int history [1000];
      for (int i=analiz_bars+poisk_fractals;i>poisk_fractals;i--)
         {
         history [i] = NormalizeDouble((tocnost*iMACD(NULL,0,Per_MACD/4,Per_MACD,9,PRICE_CLOSE,MODE_MAIN, i)/(100*Point)),0);
         }
This code outputs an array that we can use later. Here’s how you can build the filename:
      string posledovatelnost = shethik +"_";
      for (i=analiz_bars+poisk_fractals;i>poisk_fractals;i--)
         {
         posledovatelnost =posledovatelnost+history [i]+"_";
         }
      posledovatelnost = posledovatelnost +".csv";
Next, save the file with the name [posledovatelnost].
Statistical Analysis
Now, let’s dive into the statistical side of things. You’ll want to write the number of calls (which helps determine the statistical weight) and the results of the following block to that file:
      double MaxHighPik = High [poisk_fractals]; //Start comparing the bars
      double MaxLowPik = Low [poisk_fractals];
      for (i=poisk_fractals; i>=1; i--)
         {
         if (MaxHighPik < High [i])
            {
            MaxHighPik = High [i];
            }
         if (MaxLowPik > Low [i])
            {
            MaxLowPik = Low [i];
            }
         }
Here, you will determine the movement direction of the next N bars and identify the maximums reached. The results are averaged, allowing you to assign more weight to recent data using the zabyvaemost variable. Additionally, the indicator values can be averaged with the tocnost variable for more accuracy.
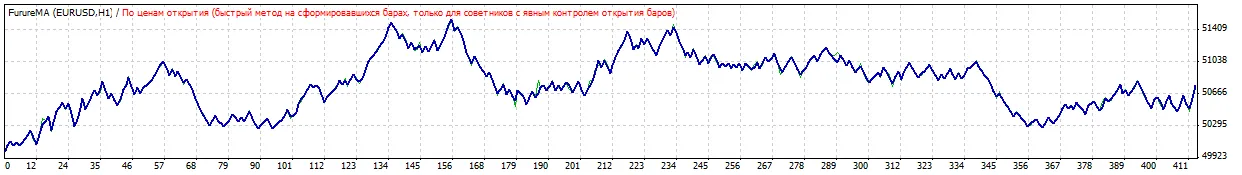
Now, here’s the catch: despite the flashy results, the profitability often hovers around 1.1, which isn’t stellar. Below is an example of using the Moving Average (MA):
If anyone out there manages to whip up a solid EA, I’d love to hear from you!


Comments 0