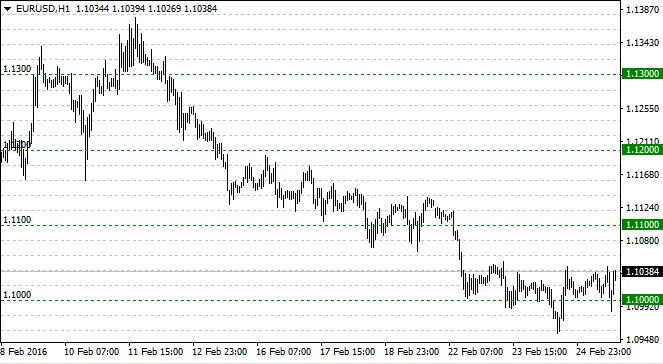
If you're looking to enhance your trading setup, the Simple Horizontal Grid indicator for MetaTrader 4 is a game changer. This handy tool places a series of adaptive horizontal lines across your chart, helping you visualize price levels with ease.
The lines are evenly spaced and automatically update whenever there’s a change in the chart. What’s great is that these lines are independent of the symbol or the scale you’re working with. So, if you decide to zoom in or out, the indicator cleverly adds or removes lines to keep things clear.
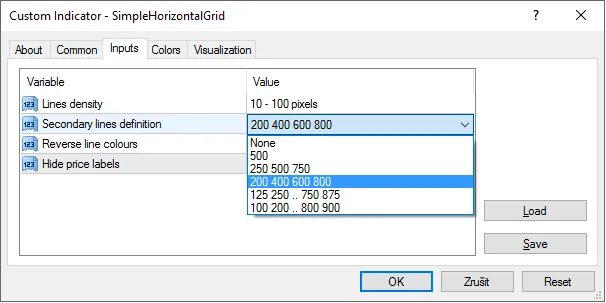
Here’s the kicker: the lines come in two colors. The primary color marks the lines at round numbers, while a softer color represents the secondary lines placed between those key levels. And if you fancy a change, you can swap the colors around to suit your style!
This indicator is ready to roll right out of the box, but it also offers some customizable settings to fit your trading needs. Here are a few additional input options you can tweak:
- Line Density: Adjust the distance between the lines.
- Secondary Lines: Choose how many secondary lines you want between each pair of primary lines.
- Label Visibility: You can turn off the primary line labels on the scale if you prefer a cleaner look.
Pro Tip:
When using the Simple Horizontal Grid, it’s best to switch off the standard grid by pressing Ctrl + G. This helps keep your chart uncluttered.
Also, if you enable object descriptions by pressing F8 and selecting Show Objects Description, you can view line labels on the left. These can serve as handy substitutes for the hidden scale labels.


Comments 0