Author: ug
Hey fellow traders! Today, we're diving into the essential concept of support and resistance levels—something every trader should have in their toolkit. I took inspiration from Vladislav Antonov's methods, which you can check out in his session reviews on platforms like Viak or Alpari. I couldn’t find a suitable indicator online, so I rolled up my sleeves and created my own. Let’s break this down:
Now, I don’t need to explain what support and resistance are, right? But there are tons of ways to spot these price levels. Personally, I rely on my own calculations. For dynamic support and resistance lines, I use Moving Average (MA) lines, while static ones come from a broader timeframe.
Calculating Intraday Levels
Here’s how you can calculate those intraday levels:
- For one hour: Use the High, Low, and Close values from the previous one-hour candlestick.
- For one day: Use the High, Low, and Close values from the previous one-day candlestick.
- For one week: Use the High, Low, and Close values from the previous one-week candlestick.
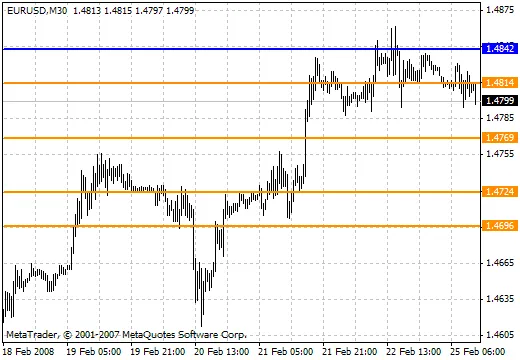
In my reviews, I typically calculate support and resistance levels based on the one-day candlestick from the previous day. This way, the levels remain valid throughout the day, but remember to recalculate them the next day. For example, if we analyze the one-day candlestick from November 2nd, we might see: High = 1.2786, Low = 1.2736, Close = 1.2780. These levels can then be applied to all charts with timeframes shorter than one day. Just keep in mind to recalculate the next day.
Three Calculation Methods
There are three methods to calculate these levels based on the size of the preceding candlestick:
- Reduced: This is for a weak market. If the market closes with a large candlestick exceeding 200 points, this method is best as a correction is likely, leading to a flat market.
- Normal: This applies to a market with average volatility. Daily candlesticks ranging from 100 to 200 points work well with this method, especially when you notice stable growth or decline with similarly sized candlesticks.
- Extended: Use this for a volatile market. If the market is tightening into a triangle and appears flat, a significant movement is likely on the horizon, so you'll want to utilize levels with a wider price range. Choosing the right method really depends on your own research and collected statistics. Personally, I trust my instincts and the anticipated price patterns.
If you want to delve deeper into this topic, feel free to check out more details here: http://www.viac.ru/ds/21950.


Comments 0