If you’re looking to enhance your trading strategy, the 3TF Stochastic Average indicator is worth considering. This handy tool displays three Stochastic Oscillators from different timeframes in a separate window, along with their average value. It’s perfect for traders who want to gauge market momentum across various timeframes at a glance.
The 3TF Stochastic Average comes with twelve customizable input parameters that allow you to tailor it to your trading style:
- Stochastic %K period - Set the calculation period for the %K line.
- Stochastic %D period - Define the calculation period for the %D line.
- Stochastic Slowing - Adjust the slowing period for the Stochastic oscillator.
- Overbought - Specify the level that indicates overbought conditions.
- Oversold - Set the level that indicates oversold conditions.
- Drawing mode - Choose how you want the indicator to be displayed:
- Steps - Displays the indicator as a ladder.
- Slope - Shows sloping lines for a smoother appearance.
- First Stochastic timeframe - Select the timeframe for the first Stochastic indicator.
- Second Stochastic timeframe - Set the timeframe for the second Stochastic indicator.
- Third Stochastic timeframe - Choose the timeframe for the third Stochastic indicator.
- Show first Stochastic - Enable to display the first Stochastic indicator.
- Show second Stochastic - Enable to display the second Stochastic indicator.
- Show third Stochastic - Enable to display the third Stochastic indicator.
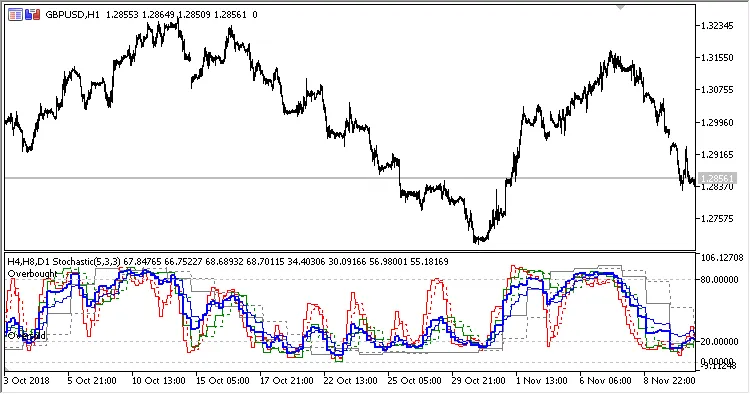
Fig.1. Three timeframes Stochastic Average, H4, H8 and D1 data on the H1 chart, Drawing mode = Steps
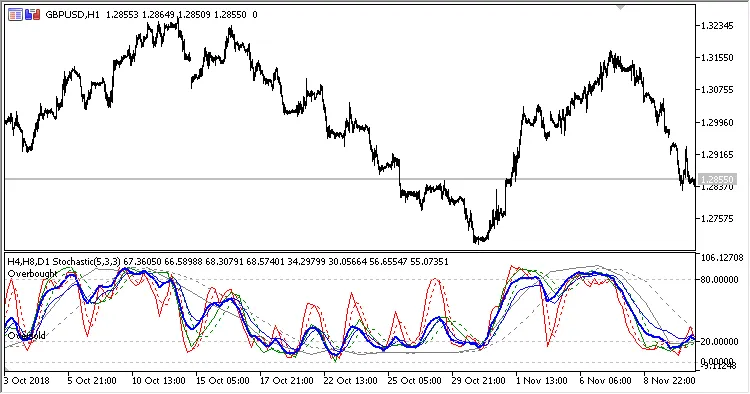
Fig.2. Three timeframes Stochastic Average, H4, H8 and D1 data on the H1 chart, Drawing mode = Slope


Comments 0